DSYNC Destra Network is a decentralized cloud solutions project utilizing AI computing mechanisms and advanced technologies like IPFS and ENS. In today’s article, we’ll explain the daily Elliott Wave structure taking place and explore the potential outcome for the token.
In March 2024, DSYNC reached a high of $0.5 marking the first rally from the lows as a wave ((1)). Since then, the token started a corrective decline unfolded as a Double Three structure. Despite losing 82% of its value during the decline, the moment it reached the blue box area at equal legs $0.11 – $0.04 buyers showed up as expected looking for a reversal to take place from there or at least a larger 3 waves bounce to happen.
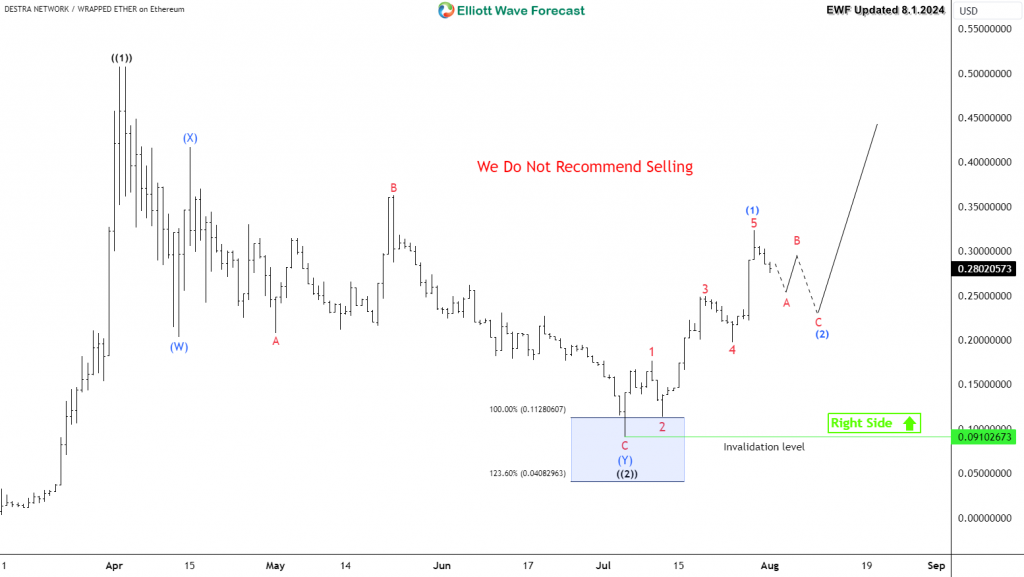
DSYNC ended the proposed wave ((2)) at the blue box area then it started the next cycle to the upside within a wave ((3)). The initial rally from the lows is showing a 5 swings advance which is considered as a bullish sequence either to define a 5 waves structure or it could turn out to be a nesting structure. Both scenarios are supporting the idea of more upside to take place and any correction should remain supported in 3 , 7 or 11 swings above July 2024 low $0.09.
DSYNC Daily Chart 8.1.2024
Explore a variety of Crypto investing ideas by trying out our services 14 days and learning how to trade our blue boxes using the 3, 7 or 11 swings sequence. You will get access to our 78 instruments updated in 4 different time frames, Live Trading & Analysis Session done by our Expert Analysts every day, 24-hour chat room support and much more.