RELIABLE EUR/USD FORECAST
Daily Accurate EUR/USD Trading Signals
1 Hour, 4 Hour, Daily & Weekly Elliott Wave Counts
Live analysis sessions and trading rooms
Daily technical videos, sequence reports & more…


EUR/USD Forecast & Signals
By applying all the above tried and tested technical analysis practices and the unique strategies developed by experts at Elliot Wave Forecast, we provide an utmost accurate EUR/USD Forecast. Being one of the major league forex pairs, EUR/USD is the most liquid and at the same time highly alluring. Therefore every trader whether amateur or professional, struggles to get an accurate reading of the market. For the same reason we at Elliott Wave with our more than 10 expert market analysts aim to make your forex trading highly profitable and help you benefit from forex markets without the need of any financial expertise. As a matter of fact, no one have the 100% accurate forecast all the time. Therefore our system of Elliott wave, market correlation, cycles, Right side and 3, 7 or 11 swings helps us to stay on the Right side of the market.

Why use Elliott Wave Forecast for EUR/USD Currency Pair?
Let our expert analysts help you trade the right side and blue boxes with timely and reliable EUR/USD forecasts.
- Daily & Weekly Technical Videos
- Live Chat Rooms
- Live Analysis Sessions
- Sequence Reports
- Free Education and Learning
- Live Trading Room Sessions
Don't take our word for it. See what our customers say
This is testing for now
"This is only for testing"

Edwardo Tellez
""Outstanding site for educational content, trading information and live sessions. If you are serious about learning to trade whether you're a beginner or expert, the talented and friendly mentors support you every step of the way!""

EUR/USD Forecast using the Blue Box Approach
Blue boxes are one of the few terminologies and technical systems that we use for analyzing our charts. It is one of the widely used boxes by our analysts at the Elliott Wave Forecast. It is designed to allocate high-frequency inflection areas of interests, which allows the traders and investors to buy or sell a currency pair, crypto, commodity, or stock at the right time with precision while being on the right side of the trend.
Learn to trade the right side with blue boxes.

EURUSD [9 December 2020]
Price entered a blue box and our members knew that 3 waves correction should end in the blue box after which price should turn higher again.

EURUSD [14 December 2020]
EUR/USD Pair found buyers in the blue box as expected and rallied 120+ pips in the next few days after hitting the blue box.
EUR/USD Forecast, News & Analysis
Check our updated for EURUSD News including real-time updates, forecast, technical
analysis and the economic latest events from the best source of Forex News
Destra Network DSYNC Started New Bullish Sequence
DSYNC Destra Network is a decentralized cloud solutions project utilizing AI computing mechanisms and advanced technologies like IPFS and ENS. In today’s article, we’ll explain the daily Elliott Wave structure taking place and explore…
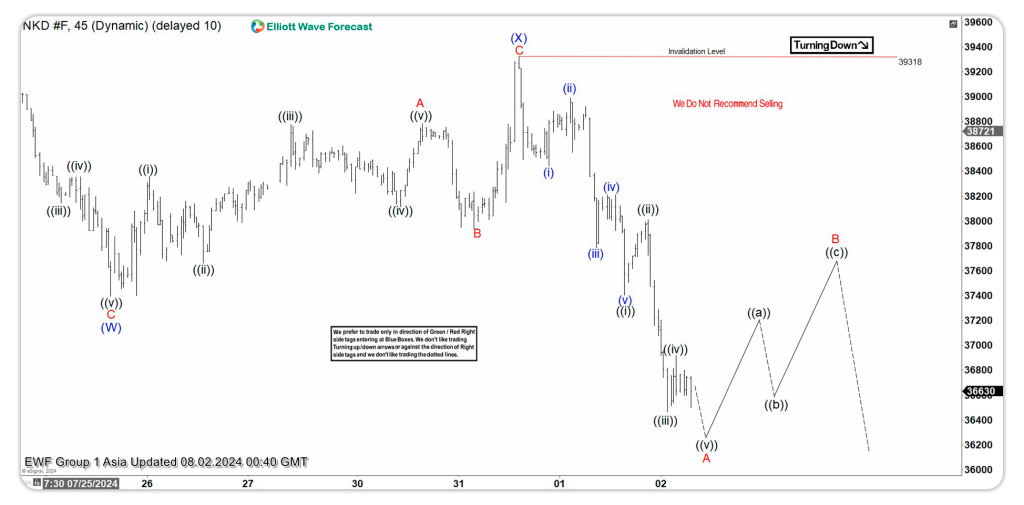
Elliott Wave Intraday Analysis Expecting Nikkei (NKD) to Extend Lower
Short Term Elliott Wave in Nikkei (NKD) suggests the Index shows short term incomplete bearish sequence from 7.10.2024 high favoring further downside. Decline from 7.10.2024 is in progress as a double…
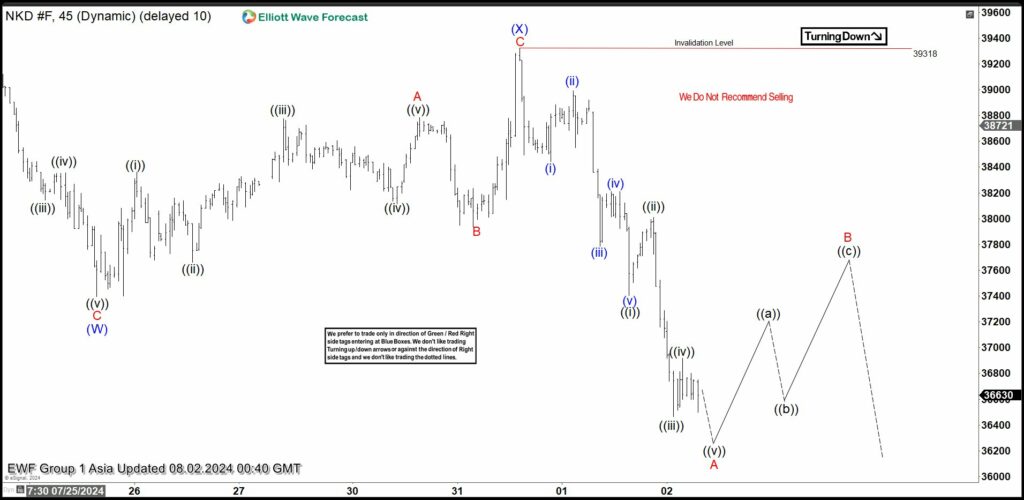
Nikkei (NKD) 45 Minutes Elliott Wave Chart
Elliott Wave Intraday Analysis Expecting Nikkei (NKD) to Extend Lower ZX Short Term Elliott Wave in Nikkei (NKD) suggests the Index shows short term incomplete bearish sequence from 7.10.2024 high…
EUR/USD Technical Analysis
Trade with confidence with exclusive Elliott Wave Forecasts
EUR/USD pair has been the most sought after forex pair globally and the first choice of almost every forex trader. Combining the top two most traded currencies in foreign exchange market, it becomes essential for a forex trader to have a crystal clear understanding about the EUR/USD Forecast.
It is a popular saying by many trading legends that behind a single profitable trade is hours of technical analysis and extensive study. Therefore entering a trade spontaneously and hoping for it to turn profitable is a one way path to failure.
We at Elliott Wave Forecast understand that not everyone can be a financial expert but that shouldn’t prevent you from taking advantage of such rewarding opportunity.

EUR/USD Technical Analysis
Combining two currency behemoths, EUR/USD is the most liquid as well as highly profitable forex pair on currency exchange and EUR carries about 58 percent weightage in the US Dollar Index basket of currencies.
Such liquidity and global acceptance makes this forex pair highly liquid and sometimes volatile but nothing is too challenging for our system of forecasting and trading. Moreover, being active 24 hours of the day, it is crucial that the technical analysis takes into the account the best time to trade EUR/USD pair because majority of the moves happen either during the London or New York session and Asian session is relatively quieter with not much movement happening in EUR/USD due to lower trading volumes.
Therefore, it is essential that your analysis has every factor calculated and leave the probability of your profits very less on chance.
Primary objective of a profitable trader is always to define the right entry point, risk and reward to risk ratio before entering the trade. Entering the trade at the right level also helps to eliminate risk on the trade as quickly as possible. This requires a forex trader to enter the trade at the right moment.
We at Elliott Wave Forecast don’t rely just on Elliott wave but several techniques including some Indicators, cycles, sequences, market correlation and right side.
Our Technical Analysis includes:
Elliott wave Analysis: The Elliott wave principle is a form of technical analysis that traders use to analyze cycles in financial assets and forecast the trend by identifying extremes in investor psychology, highs and lows in prices, and other factors.
Swing Sequences:
Swing sequences plays a crucial role in our technical analysis in determining the accurate wave count and also in identifying trading opportunities based in incomplete swing sequences. For instance, an impulsive sequence runs in 5,9,13,17 swings and so and a corrective sequence runs in 3,7,11,15 swing and so. So if EUR/USD move is unfolding an impulse and we can only count 11 swings that would suggest sequence is incomplete and hence we would look for another high to make it 13 swings and complete the sequence. This avoids prematurely calling completion of an impulse or corrective Elliott wave structure.
Market Correlation:
Correlation is a statistical measure that determines how assets move in relation to each other. It can be used for individual securities, like stocks, forex pairs, commodities or stock markets or it can measure general market correlation, such as how asset classes or broad markets move in relation to each other. We at Elliott wave, use direct correlation as explained above and also we use a lot of second dimension correlation in which different assets correlation in the swings but not in the direction.
Right Side: Another major aspect which almost all traders ignore is the analysis of right side or the trend as some would call it. Knowing the Right side helps a forex trader to avoid trading against the right side or avoid trading against the trend. For an instance when the trend is up, even a negative economic release doesn’t have too much negative impact on the price or during a downtrend (right side down), even GDP growth doesn’t move the price of forex pair higher by a lot. Understanding market sentiment or activity and Right side is crucial and can prove to be an essential tool in the analysis. Our experts mention the Right side on each chart to help a forex trader avoid trading against the Right side.
Identifying High Probability Buying and Selling Areas:
Boxes are high-frequency and high probability inflection areas which are based in a relationship of sequences, cycles and calculated using Fibonacci extensions. In a blue box, both buyers and sellers again in direction of next move for 3 swings at least and provide great entry points with a well defined risk to enter the market in the direction of the trend. Majority of the times, trend would either resume from the blue box resulting in profits for the forex trader or it results in a 3 waves reaction at least to allow forex traders to eliminate risk on the trade.
Indicator Analysis: This includes analysing various chart indicators like Relative Strength Index and Stochastics. Experts at Elliot Wave Forecast use these indicators in a unique way to achieve most accurate EUR/USD forecast which was developed with their decades of experience in the industry. For instance, experts at Elliott wave forecast, use RSI to differentiate between Impulsive and Corrective structures and also use it to identify the end of a cycle.
Trend Reversal: Most rewardingly profitable trades are the ones which are positioned at trend reversals. A trend reversal is a time at which it is expected that the forex pair is going to experience a change in trend from the ongoing trend. It can be a change from an uptrend to the downtrend and vice versa. Our experts identify trend reversal or end of a cycle in EUR/USD using tools like price trend line break and other methods.
Volume Distribution: As forex markets are open 24 hours of the day, it is essential to trade at the time when the forex pair intended to be traded is experiencing highest volume. This also adds to the momentum leading to more liquidity and higher profit potential.
Global Events Impact: Events worldwide can’t be discounted when it comes to forex trading, particularly EUR/USD. However, we believe a global even might change the price action or wave structure in the short-term but can’t change the underlying trend or the long-term wave structure. For instance is EUR/USD is trending higher and some extremely negative news hits the wires, it could create a sudden drop changing the structure to Elliott wave FLAT correction after which EUR/USD can resume the uptrend.