RELIABLE USD/CHF FORECAST
Daily Accurate EUR/JPY Trading Signals
1 Hour, 4 Hour, Daily & Weekly Elliott Wave Counts
Live analysis sessions and trading rooms
Daily technical videos, sequence reports & more…


USD/CHF Forex Trading Signals
Trade with confidence with exclusive Elliott Wave Forecasts
The USD/CHF is the short abbreviation for the currency pair of U.S. dollars and Swiss Franc. The USD/CHF currency pair’s primary purpose is to elucidate the exchange rate of the USD (base currency) and CHF (the quote currency). The exchange rate represents the total amount of Swiss Franc (CHF) required to buy one U.S. dollar (USD).
In the trading and investing world, the USD/CHF is often regarded as trading the “Swissie.”
USD/CHF is one of the eye-catching pairs in the forex markets, even though it includes the swiss franc currency, which is not considered volatile or popular in forex markets; however, it has its safe-haven element with it. This makes it volatile sometimes, and traders are able to catch massive and lucrative trading opportunities. At Elliot wave forecast, we use highly probable blue boxes (discussed below) as our primary indicator for indicating the price movements. For this reason, our highly probable blue boxes allow us to be on the right side of the trend and attain massive technical opportunities, even if they are driven due to fundamental reasons.
We at Elliott Wave Forecast understand that not everyone can be a financial expert but that shouldn’t prevent you from taking advantage of such rewarding opportunity.

Why use Elliott Wave Forecast for USD/CHF Currency Pair?
Let our expert analysts help you trade the right side and blue boxes with timely and reliable USD/CHF forecasts.
- Daily & Weekly Technical Videos
- Live Chat Rooms
- Live Analysis Sessions
- Sequence Reports
- Free Education and Learning
- Live Trading Room Sessions
Don't take our word for it. See what our customers say
This is testing for now
"This is only for testing"

Edwardo Tellez
""Outstanding site for educational content, trading information and live sessions. If you are serious about learning to trade whether you're a beginner or expert, the talented and friendly mentors support you every step of the way!""

USD/CHF Forecast using the Blue Box Approach
In a nutshell, the blue boxes are high-frequency inflection areas that our analysts orchestrate on the charts. The blue boxes are referred to as the ultimate entry areas where buyers and sellers of a market are in alignment, signaling a trend change or trend continuation. The blue boxes are also orchestrated on specific areas of a chart where a corrective sequence might occur. For instance, the blue boxes display 3,7 and 11 swings to end. Blue boxes are very low-risk areas where there is a higher probability of attaining a good trading opportunity and staying on the trend’s right side.
Learn to trade the right side with blue boxes.

USDCHF [9 February 2020]
Price entered a blue box and our members knew that 3 waves correction should end in the blue box after which price should turn lower to resume the decline or for 3 waves pull back at least.

USDCHF [3 March 2020]
USD/CHF Pair founds sellers in the blue box as expected and dropped over 200 pips in the next few days after hitting the blue box.
USD/CHF Forecast, News & Analysis
Check our updated for USD/CHF News including real-time updates, forecast, technical
analysis and the economic latest events from the best source of Forex News
Destra Network DSYNC Started New Bullish Sequence
DSYNC Destra Network is a decentralized cloud solutions project utilizing AI computing mechanisms and advanced technologies like IPFS and ENS. In today’s article, we’ll explain the daily Elliott Wave structure taking place and explore…
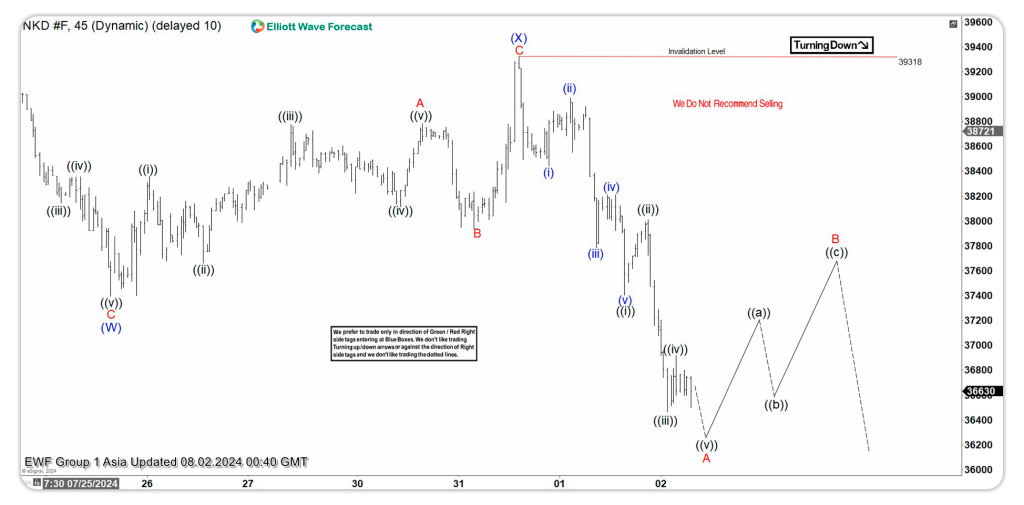
Elliott Wave Intraday Analysis Expecting Nikkei (NKD) to Extend Lower
Short Term Elliott Wave in Nikkei (NKD) suggests the Index shows short term incomplete bearish sequence from 7.10.2024 high favoring further downside. Decline from 7.10.2024 is in progress as a double…
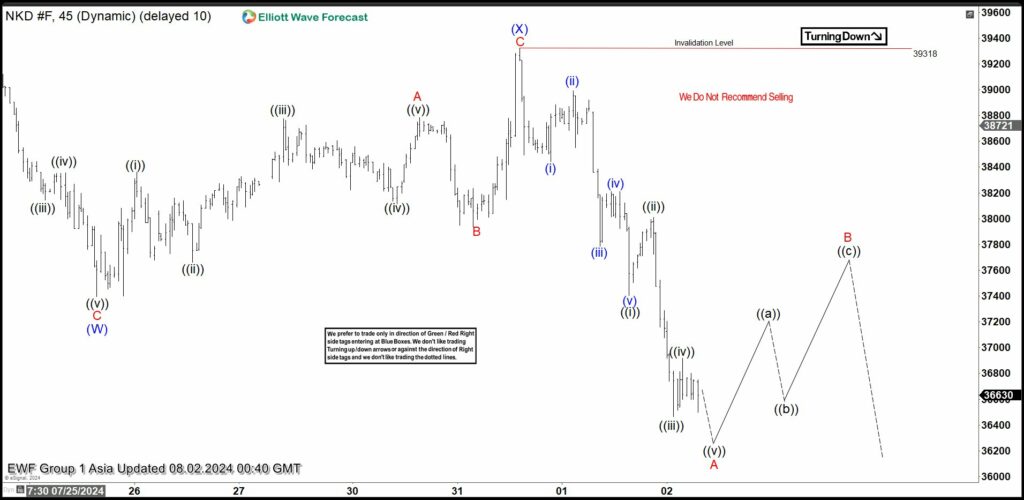
Nikkei (NKD) 45 Minutes Elliott Wave Chart
Elliott Wave Intraday Analysis Expecting Nikkei (NKD) to Extend Lower ZX Short Term Elliott Wave in Nikkei (NKD) suggests the Index shows short term incomplete bearish sequence from 7.10.2024 high…
USD/CHF Forecast & Signals
Understanding the exchange rate of USD/CHF is relatively easy. For instance, if the price of the USD/CHF currency pair is hovering around 1.12, it means that it will take over 1.12 swiss francs to buy one U.S dollar. While this is one of the most basic information of a currency pair, it is equally important to understand such elements as essential to trade these pairs.
As the USD/CHF currency pair is pegged with the USD (base currency), it is affected by a plethora of factors. Such factors include fundamentals, which are further divided into economic fundamentals and geopolitical fundamentals. For instance, employment data and the gross domestic product are some of the key factors that indicate this pair’s movement. At Elliot wave forecast, we do not use fundamental analysis as our primary way of trading; we do not think that fundamentals are crucial for predicting price movements. Instead, we use technical analysis and technical indicators for predicting educated and high probability price movements.

EUR/JPY Technical Analysis
Elliott Wave Analysis
One of the most effective trading strategies to trade USD CHF is Elliott Wave Analysis. Elliott wave analysis is considered one of the most efficient ways of analyzing the markets. It allows traders and investors to project potential waves that may occur in the market. Trading a safe haven pair such as USD CHF, Elliot wave analysis can be highly effective. It represents pinpoint Ewave structures that help traders anticipate a potential bullish or bearish wave. In addition, it also allows traders to stay on the right side of the trend. The good news is that our professional analysts and traders at Elliott Wave Forecast highly utilize this tool when making trading and investing decisions.
Along with Elliot wave analysis, our traders also conduct a different variety of analyses. Some of the analysis patterns and tools in our technical arsenal include market correlations, cycles, market dynamics, and sequences. This allows us to make educated predictions upon where the next wave of the market might move. Since many of you already know that the most significant reason for failure in trading is trading against the trend, Elliot wave analysis allows you to stay on the right side of the trend and help you avoid trading against the trend at all times. Our analysts profoundly analyze the market with the help of Elliot wave structures, cycles, and waves which help them create high probability areas of interest, which we usually like to call “Blue Boxes.” This helps us avoid trading against the trend and take high probability trading setups, which allows us and our followers to attain lucrative and highly profitable trading opportunities.
Fibonacci
Fibonacci is one of the most-used technical indicators/tools, which allows traders to attain specific price levels where a certain retracement or extension (trend continuation) might occur. The Fibonacci tool comes in a combination of different numbers. In general, these numbers are characterized by Fibonacci retracements and Fibonacci extensions. One of the biggest mistakes novice traders make is using the Fibonacci tool as a sole technical indicator for their trading decisions. Thus, there is a higher failure in their trading careers. Our traders at Elliott Wave Forecast use the Fibonacci tool along with wave analysis and sequences. Which, in turn, helps us make wiser and profitable trading decisions.
Trendlines
Trendlines are also one of the most used technical tools in the forex, commodity, crypto, and stock markets. The trendlines allow traders to witness the slope of the trend. One of the rules to remember when using trendlines is that the steeper the trendline, the strong the trend is. For example, if you connect three or more Lower Highs (LH) in a bearish trend, the trendline shows a steep momentum to the downside. It signifies that the trend is robust to the downside, and the bears are still in control, which helps us understand the trend and allows us to stay on the right side of the trend. On the other hand, if the trendline does not show steepness or specific inclination, it signifies that the trend is not so strong, and bulls might take over in the near term. Our traders highly utilize this tool to gauge trendline breaks and potential trend reversals.
Market Correlations
The past price chart history of the USD CHF currency pair has a consistent negative correlation with EUR USD. This is because of a plethora of different fundamental factors. However, we use different correlation concepts, including first- and second-dimension correlations, and correlate a single pair with varying classes of assets. This allows us to make wiser and profitable trading decisions. In this way, we are able to attain lucrative trading opportunities for our investment portfolios and our clients.
USD CHF Live Price chart History
The Swiss franc is a safe haven currency. It is a vital element that makes it so important and popular for many traders in the forex markets. In a nutshell, the safe-haven currency is the currency that every investor and trader seeks to invest in during political disasters, economic uncertainty, natural disasters, or any unrest that may hurt the market sentiment or overall market environment. During the great recession of 2007-2009, the Swiss franc was one of the currencies that showed great strength against all the major currencies. This was when the CHF portrayed its safe-haven status. Nevertheless, in the aftermath of the great recession, USD/CHF posted its lowest lows/bottom in August 2011 at 0.7066