RELIABLE FTSE INDEX FORECAST
Daily Accurate FTSE Index Trading Signals
1 Hour, 4 Hour, Daily & Weekly Elliott Wave Counts
Live analysis sessions and trading rooms
Daily technical videos, sequence reports & more…
FTSE Index Trading Signals
Trade with confidence with exclusive Elliott Wave Forecasts
The FTSE 100 index or commonly known as the Footsie index comprises over 100 public companies traded on the London Stock Exchange. The companies compromised in this index are the most prominent companies of the United Kingdom regarding their Market Capitalization. These companies are so large that Ftse 100 represents more than 80% of the overall market cap valuation of the London Stock Exchange (LSE). FTSE 100 is short for financial times and the London stock exchange, and it is maintained and orchestrated by the LSE group. It holds similar importance as the Dow Jones and S&P 500 index, which are considered significant indexes in the stock markets around the world. Moreover, the value of the FTSE 100 index is calculated by assessing the overall market capitalization of the 100 companies comprised in the index.
When trading indexes such as FTSE 100, it is highly crucial to evaluate your trading strategy and assess what kind of trader you want to be. Some of the questions you may want to ask yourself are: Do I have a working trading strategy? Am I going to be a positional, swing, or day trader? These will help you understand and assess your overall trading plan. Our traders and Analysts at Elliott Wave Forecast profoundly utilize the Elliott Wave Analysis tool along with other technical tools in our trading arsenal.
We at Elliott Wave Forecast understand that not everyone can be a financial expert but that shouldn’t prevent you from taking advantage of such rewarding opportunity.
Why use Elliott Wave Forecast for FTSE Index?
Let our expert analysts help you trade the right side and blue boxes with timely and reliable FTSE forecasts.
- Daily & Weekly Technical Videos
- Live Chat Rooms
- Live Analysis Sessions
- Sequence Reports
- Free Education and Learning
- Live Trading Room Sessions
Don't take our word for it. See what our customers say

FTSE Index Forecast using the Blue Box Approach
At Elliott Wave Forecast, the jargon for high-frequency inflection areas, where there is a greater likelihood of a shift to the right side of the trend, is called and configured as “Blue Boxes.” In general, these blue boxes are helpful in obtaining a precise market outlook because they allow you to use high-inflection areas where there is a higher risk of a trend reversal or trend continuity, as well as more chances for you to get in and acquire a favorable and profitable trading opportunity. It elucidates and characterizes items such as 3, 7, or 11 swings to finish. The blue boxes also reflect the base region of various Fibonacci extensions and intervals. With such well-choreographed boxes on our chart, we will reach the market at the right time and on the right side of the pattern.
Learn to trade the right side with blue boxes.
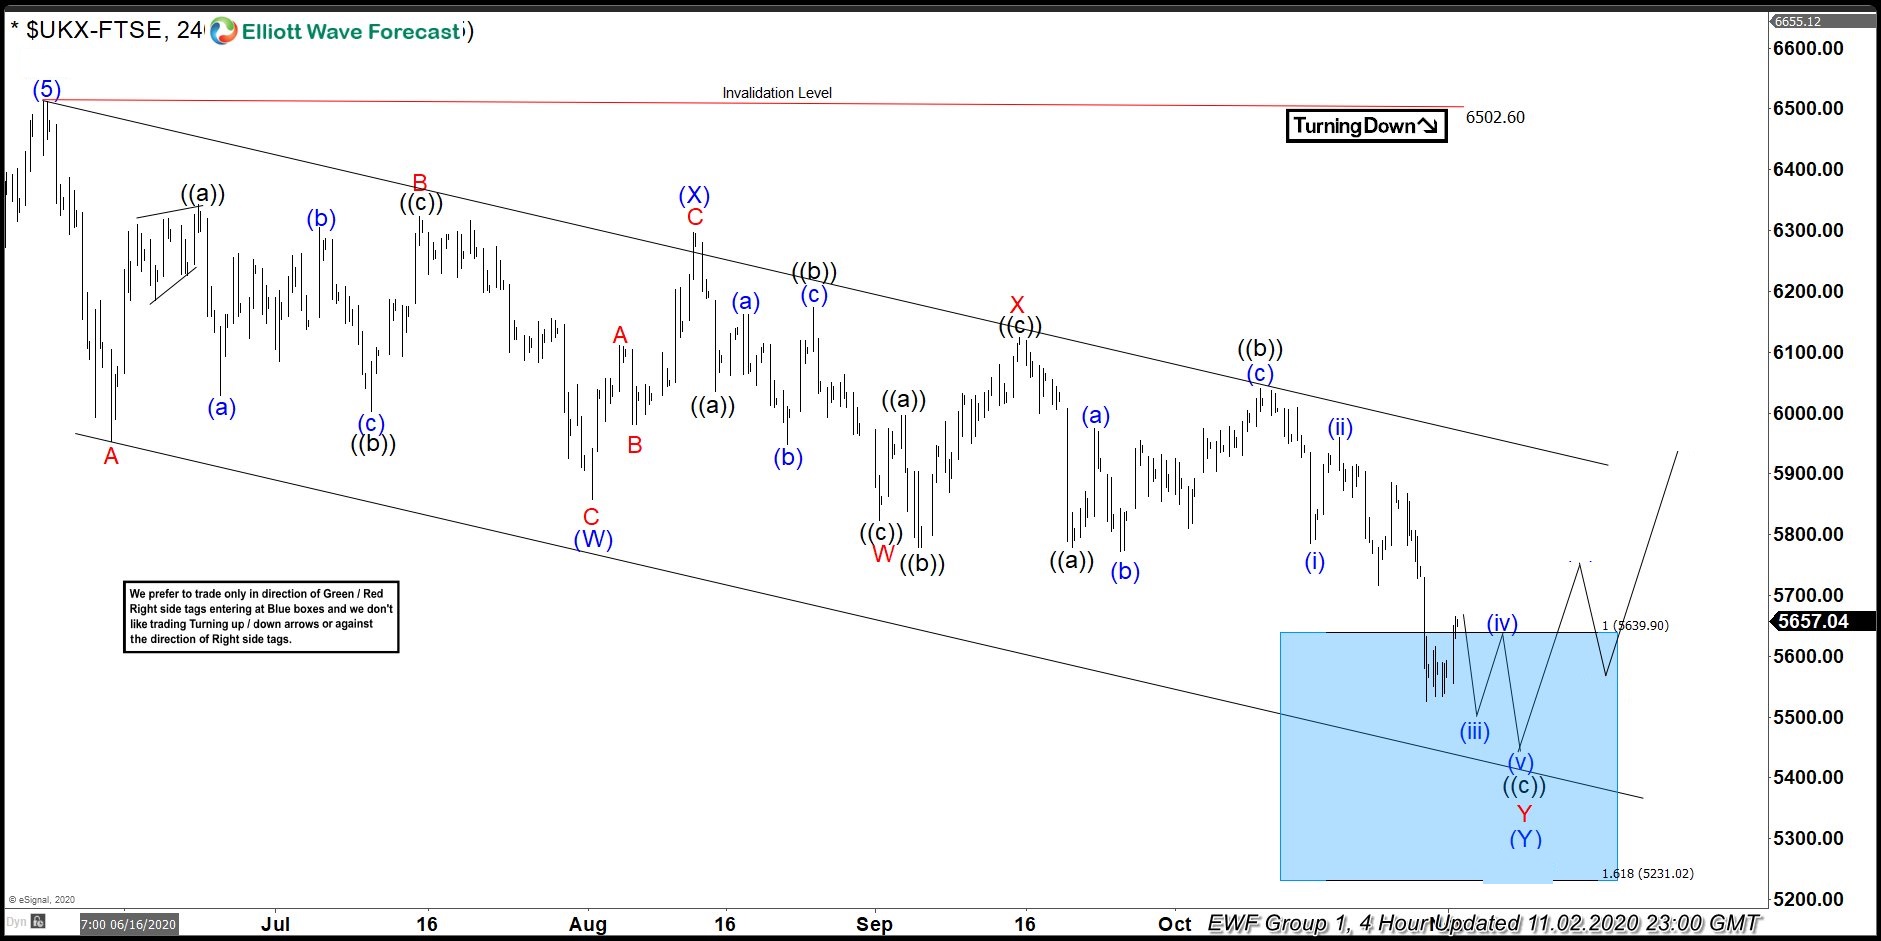
FTSE [2 November 2020]
Price reached the blue box and our members knew that 7 swings double three correction should end in the blue box after which rally should resume.
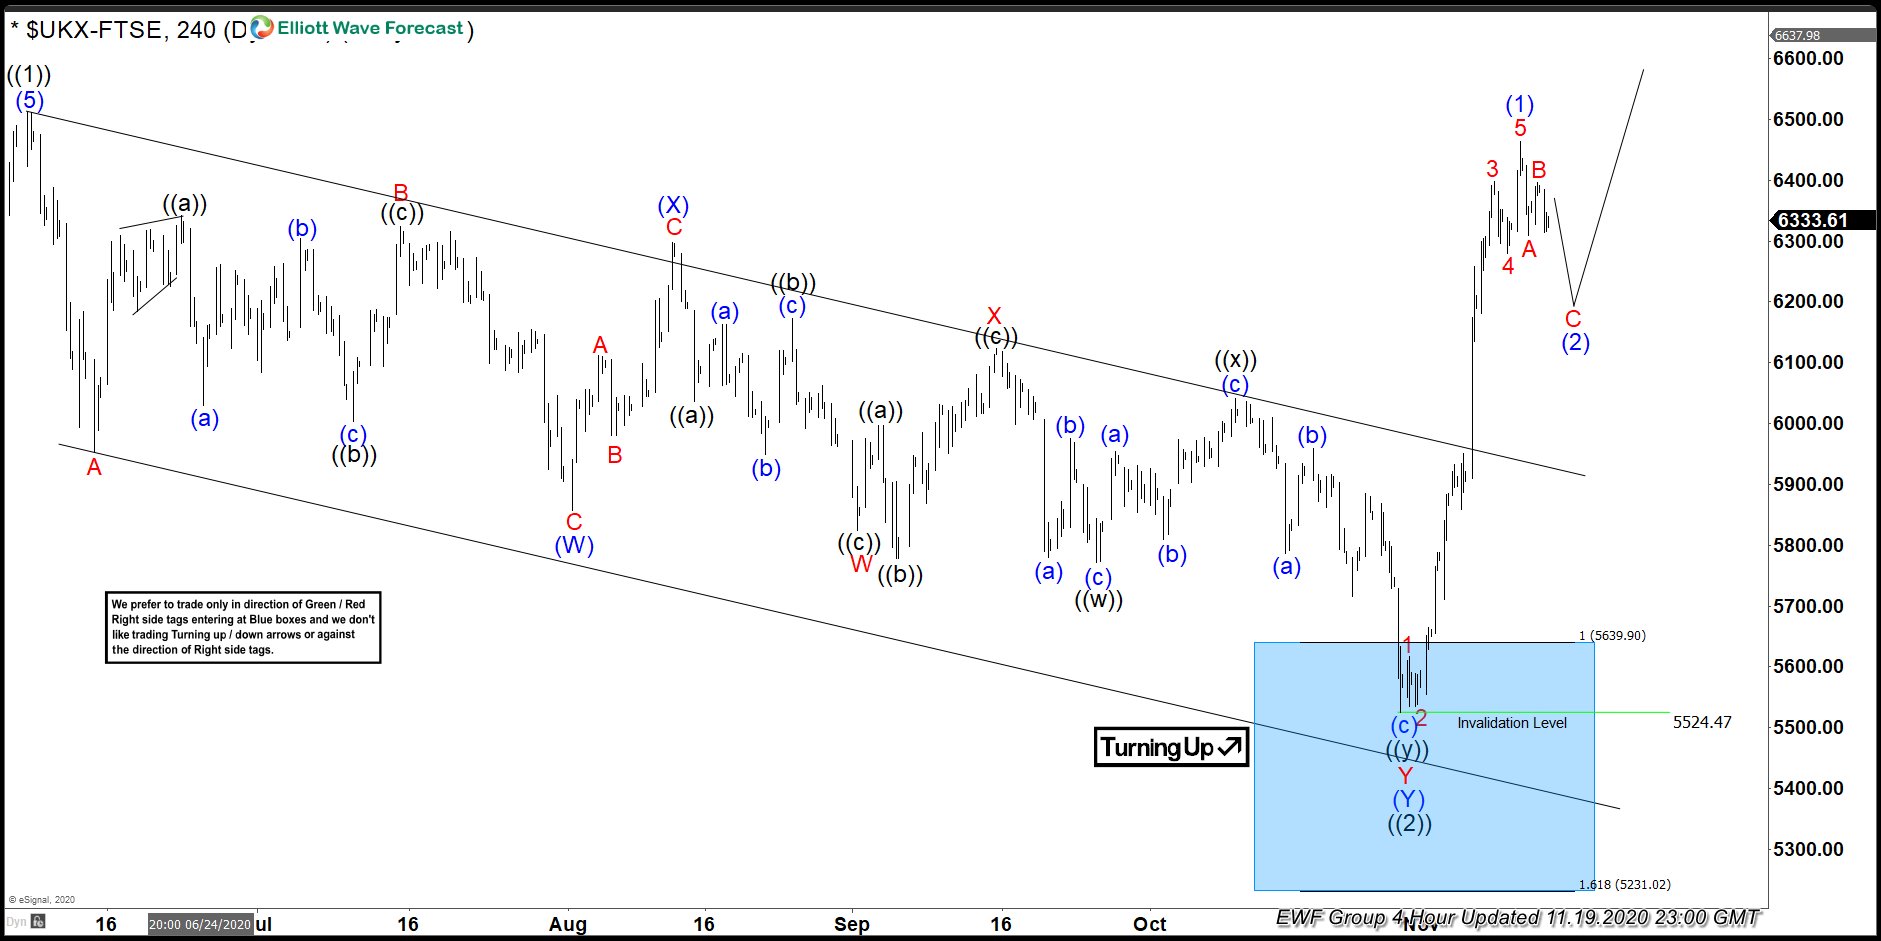
FTSE [19 November 2020]
FTSE founds buyers in the blue box as expected and rallied over 900 points in the next couple of weeks producing nice profits for our members
FTSE Index Forecast, News & Analysis
Check our updated for FTSE Index News including real-time updates, forecast, technical
analysis and the economic latest events from the best source of Stock Market News
What Moves FTSE 100 Market?
If you want to trade highly volatile indexes such as the FTSE 100, it is crucial for you to keep an eye on the essential fundamental indicators that may create volatility in the market. Our traders and analysts at Elliott Wave Forecast do not utilize any fundamental analysis for making trading decisions, as we think our technical arsenal gives us a crucial edge in defining the fundamental and technical moves at the same time. Nevertheless, the following are some of the essential indicators and events that may move the overall value of the ftse 100 index.
Political and Economic Events
Political disturbance and economic uncertainty are key factors that dictate the overall value of ftse 100. In general, all the indexes are highly vulnerable to economic uncertainties and political turmoil. Thus, it is crucial to keep an eye on such political and economic events. For instance, the Brexit and COVID cases surge/recovery hopes. Such circumstances can dictate the overall value of Ftse 100.
Interest Rates
Fundamental indicators such as Interest rates can have a significant impact on Ftse 100 index. Generally, whenever the interest rates are expected to increase, the Ftse 100 tends to fall, as it becomes costly for corporate businesses to repay their loan terms.
Earnings Reports
Did you know why the traders at wall street have multiple screens? It is because they go through and track high volumes of data. Some of those data numbers include earning reports. Earning reports are considered necessary for the local currency’s stock market, as these earning reports represent the companies’ financial statements that are listed in these indexes. Generally, if the earning reports are worse than expected of more than ten companies, the FTSE 100 can hit a big hit.
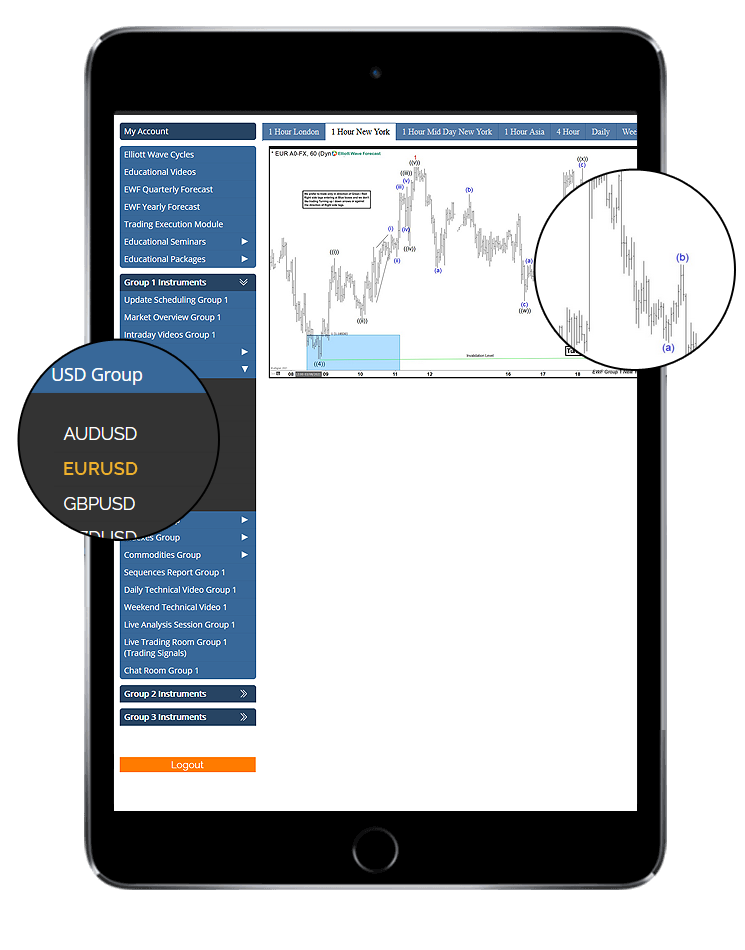
FTSE Forecast, Signals and Technical Analysis
Elliott Wave Analysis
Since the Ftse 100 is an index, Elliot wave analysis may be a valuable method for predicting the overall index’s outlook and market movement. Elliott Wave Analysis allows traders to see specific points on the charts where large price waves can occur and finish. It is a very versatile tool that can be used with other technical instruments. We use Elliot wave analysis in conjunction with other technical methods such as sequences, market dynamics, trendlines, Fibonacci, intervals, and market correlations to create a perfect approach with Elliot wave analysis. This allows us to have a very informed and accurate market outlook, allowing us to stay on the right side of the trend. There are many advantages of using Elliot wave analysis to forecast the Ftse 100 index. It enables you to curate and orchestrate possible areas of interest in which a trend reversal, trend progression, or trend end can occur.
Fibonacci
Fibonacci is a well-known instrument in financial culture. Nonetheless, the tool is used across asset classes, including securities, cryptos, forex, and stocks, but it is most common and well-known in the forex and index community. Fibonacci numbers will help you identify possible pattern retracement or extension stages. When trading with Fibonacci, traders often use the golden number 1.618 percent or 61.8 percent. However, it is critical not to rely solely on Fibonacci in your trading strategy. Elliott wave forecast uses Fibonacci analysis alongside other technical methods such as market cycles, structures, Elliot wave analysis, trendlines, and blue boxes. This enables us to stay on the right side of the trend and achieve a high chance, higher win ratio in our trading systems.
Trendlines
Trendlines, as the name implies, are just lines that can be drawn anywhere on the chart. The majority of traders draw trendlines on the charts by linking the wicks of candles. The primary function of trendlines is to show the frequency of a trend or a specific trend reversal in the primary trend. When using trendlines, the rule of thumb is that “the steeper the trendline, the broader the trend.” This suggests that a steep trendline indicates and characterizes a substantial trend. It also warns not to deviate from the trend. If the trendline is not steep enough, it shows a slow trend. Trendlines are used in Elliot wave forecasts to gauge price tendency and determine the primary trend.


