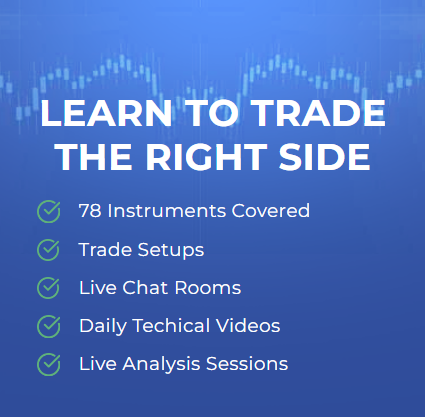
RELIABLE DAX INDEX FORECAST
Daily Accurate DAX Index Trading Signals
1 Hour, 4 Hour, Daily & Weekly Elliott Wave Counts
Live analysis sessions and trading rooms
Daily technical videos, sequence reports & more…


DAX Index Trading Signals
Trade with confidence with exclusive Elliott Wave Forecasts
The Dax 30 has been handled for over 30 years, providing technical analysts with a wealth of historical trading analytical tools to construct charts and analytical trade set-ups. In a continually changing environment, technical analysis aids in the visualization of patterns, trends, and pricing points.
Dax 30 is just like other indexes; in fact, it is very similar to trading a variety of other financial instruments. The objectives for entering and quitting a trade, concentration, and mentality remain consistent and vital.
A trader should ensure that they correctly understand the product and the trading platform they intend to utilize, such as options or futures trades. A trader must know why he or she is joining the trade and should not be misled by market “nonsense” or opinions. A trader must also be professional enough not to allow the market to fool him or her into an indecisive or deceiving trade opportunity.
We at Elliott Wave Forecast understand that not everyone can be a financial expert but that shouldn’t prevent you from taking advantage of such rewarding opportunity.
Why use Elliott Wave Forecast for DAX 30 Index?
Let our expert analysts help you trade the right side and blue boxes with timely and reliable DAX Index forecasts.
- Daily & Weekly Technical Videos
- Live Chat Rooms
- Live Analysis Sessions
- Sequence Reports
- Free Education and Learning
- Live Trading Room Sessions
Don't take our word for it. See what our customers say
This is testing for now
"This is only for testing"

Edwardo Tellez
""Outstanding site for educational content, trading information and live sessions. If you are serious about learning to trade whether you're a beginner or expert, the talented and friendly mentors support you every step of the way!""

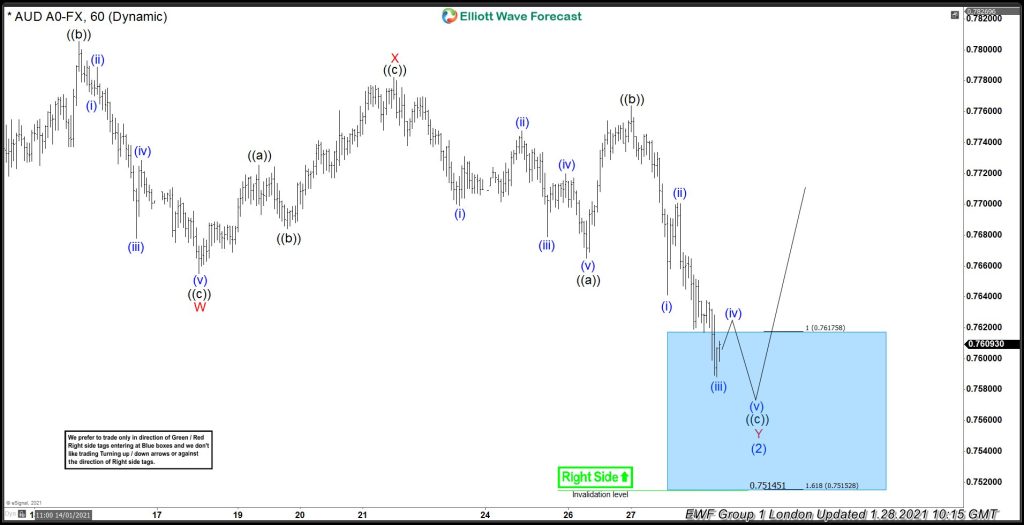
DAX Forecast using the Blue Box Approach
Analysts and traders at Elliott Wave Forecast choreograph high-frequency inflection zones of worry, where buyers and sellers are more likely to agree to move in a specific direction in the future. This allows you to choreograph specific entry locations and analyze whether the pattern will continue or if a turnaround will occur. These high-frequency inflection zones or unique entry locations are highlighted and referred to as “Blue Boxes” in the Elliot wave forecast. Furthermore, the blue boxes signify and explain the 3,7, or 11 swings to completion. Again, by merging Fibonacci extensions with other technological tools, the blue boxes are staged and controlled. These blue boxes show high-probability, low-risk locations of interest with the potential to extract at least three swings on the trend path’s right side.
Learn to trade the right side with blue boxes.

DAX Index [24 March 2021]
Price was expected to drop into the blue box and our members knew that 3 waves correction should end in the blue box after which price should turn higher again in wave 5.

DAX Index [29 March 2021]
DAX Index founds buyers in the blue box as expected and rallied over 350 points in the next few days producing nice profits for our members
DAX 30 Index Forecast, News & Analysis
Check our updated for DAX 30 Index News including real-time updates, forecast, technical analysis and the economic latest events from the best source of Stock Market News
Destra Network DSYNC Started New Bullish Sequence
DSYNC Destra Network is a decentralized cloud solutions project utilizing AI computing mechanisms and advanced technologies like IPFS and ENS. In today’s article, we’ll explain the daily Elliott Wave structure taking place and explore…
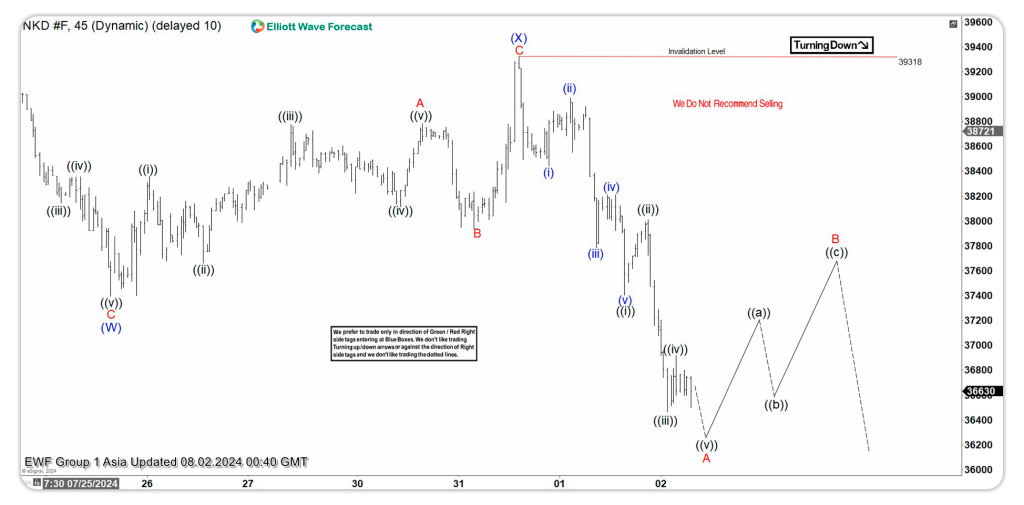
Elliott Wave Intraday Analysis Expecting Nikkei (NKD) to Extend Lower
Short Term Elliott Wave in Nikkei (NKD) suggests the Index shows short term incomplete bearish sequence from 7.10.2024 high favoring further downside. Decline from 7.10.2024 is in progress as a double…
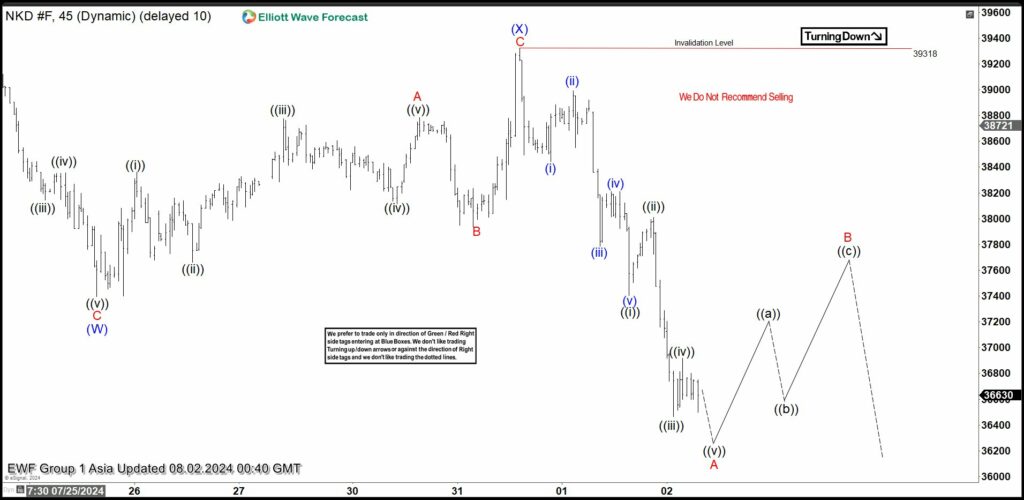
Nikkei (NKD) 45 Minutes Elliott Wave Chart
Elliott Wave Intraday Analysis Expecting Nikkei (NKD) to Extend Lower ZX Short Term Elliott Wave in Nikkei (NKD) suggests the Index shows short term incomplete bearish sequence from 7.10.2024 high…
DAX Index Forecast & Signals
The Dax 30 is among the world’s most extensive most frequently traded indexes, offering traders extraordinary volatility, minimal trade spreads, and extended trading hours. The DAX’s FSE trading hours are 09:00 GMT to 17:45 GMT, and most sources will indeed offer prior and post-market signals. This is to assist traders in determining where markets are scheduled to open and where they will be referenced after the authorized market closes.
Dax tendencies may be easily seen, making it a famous trading market. Furthermore, Dax traders consider the technical characteristics to be transparent over a wide range of periods. Because of these variables, traders from all over the globe monitor the Dax and utilize it to gain or mitigate their risk to stocks.
Traders should search for opportunities to trade the Dax 30 whenever the market is full of liquidity. Trading in low-liquidity situations exposes traders to low-volume ‘fluctuations’ or ‘snippets,’ which may disrupt usual trading patterns.

EUR/JPY Technical Analysis
Elliott Waves Analysis
Elliott Wave Forecast’s traders and analysts employ various tools and analytics to give our clients the most up-to-date, knowledgeable, and accurate trading decisions. Because of the index’s significant volatility, our traders provide Dax predictions using Elliott Wave analysis. Elliott Wave analysis is a critical tool for traders to evaluate a particular market’s general direction and pattern. It also permits traders to forecast significant price movements ahead of time. Our traders employ Elliot wave structure when doing Elliot wave research on a specific pair, index, or asset. Elliot wave structures are particular positions that enable one to recognize and forecast a significant market move or future wave that may occur.
Furthermore, this helps one remain on the right side of the trend rather than “trading against the trend.” Our traders recognize that betting against the pattern may be highly costly and harmful to beginner traders’ funds. As a result, we’ve devised tactics that are in line with our clients’ individual capabilities. Our services not only help you earn money, but they also teach you the principles and core of the precise technical analysis.
In addition, our traders employ a range of methodologies, such as market correlations, sequences, market patterns, wave structures, Fibonacci, trendlines, and Elliot wave analysis. Such technical frameworks and research allow us to correctly study any index, product, business, or asset class while keeping on the right side of the trend. These tools will help us choreograph and pick portions of the charts with a better possibility of pattern continuance or trend reversal. These areas of concern are plainly labeled “Blue Boxes.”
Fibonacci
Fibonacci is a popular method among both high-end customers and traders. The Fibonacci sequence is well-known, and traders may utilize it for scalping, day trading, swing trading, and even position trading. The Fibonacci tool may help you locate precise areas of retracement and pattern extensions at a price. For example, if a trend grows (higher highs and lower lows), we will drag our Fibonacci tool from the low of the trend to its top. Consequently, the golden Fibonacci number of 61.8 percent will operate as our center zone of retracement for a future upward rise. Fibonacci is commonly applied in trading methods such as “buy the dip” and “sell the rebound.” Elliott wave Forecast traders rely considerably on the Fibonacci ratio in their technical arsenal. Fibonacci is utilized for various purposes. For example, we apply Fibonacci to construct probable retracement levels and profit target levels (via Fibonacci extensions) (through Fibonacci extensions). We also employ Fibonacci to choreograph the high-frequency inflection zones of our “Blue Boxes.” The days of trawling Google for Dax Signals are long gone, owing to the Elliot wave forecast.
Trendlines
Trendlines are one of the most fundamental and often-used technical tools. The bulk of traders employ it owing to its simplicity and ease of use. However, most rookie or intermediate-level traders are uninformed of trendlines’ possibilities or do not know how to use them correctly. Trendlines, in a nutshell, are used to quantify and assess the strength of a specific trend. For instance, if the trendline is steeper and more aligned, it implies that the trend is strong. A prolonged and slow trend is indicated by a less steep trendline and is not aligned at all. The trendline aids us in identifying the strength of the trend and making better trading picks. Trend Lines are employed by Elliot wave prediction specialists as a point of convergence with various technical instruments. We, for example, utilize trendlines in tandem with the RSI indicator and a bespoke distribution mechanism. This enables one to determine the end of a given period.
Market Correlations
According to reputable authorities, the Dax index has more than 90 percent positive correlations with total key US Stock indexes. Moreover, the Dax also has a negative correlation with the Euro, which is up to 70 percent. Traders and investors may utilize this knowledge to make more informed and informed trading/investing choices! Our analysts undertake market correlation analysis across numerous asset classes, including first- and second-dimension market correlations. In this approach, we are able to stay on the overall correct side of the trend and make better trading judgments.
What Drives the Valuation of Dax Index
Many factors come into play while trading the Dax, and traders must be mindful of their possible influence and influence on the benchmark index valuation. The highest level macroeconomic tunes, global principles, and economies and micro-themes such as business and industry developments and values are among these factors.
○ Knock-on impacts — Global markets are interwoven. The trickle-down effect of an industry problem in one nation affects sentiment in the same industry in other countries across the world.
○ Index company weightings — a 5% price movement in one Dax business might have an entirely different influence on the index than a 5% change in another business with a distinct information weighting.
○ Brexit, the Brexit outcomes regarding Hard or Soft Brexit can have a severe effect on the overall valuation of the Dax index.
○ The effect of a stronger or weaker Euro would vary for importers and exporters.
○ Regional and global commerce battles raise concerns about the impact of tariffs on Dax’s numerous firms and sectors.
○ Currency conflicts will affect exporters’ bottom lines, impacting their stock price and market capitalization.