RELIABLE AUD/USD FORECAST
Daily Accurate AUD/USD Trading Signals
1 Hour, 4 Hour, Daily & Weekly Elliott Wave Counts
Live analysis sessions and trading rooms
Daily technical videos, sequence reports & more…

AUD/USD Forex Trading Signals
The AUD USD currency pair represents over 5% of the entire Forex market in terms of volume. Traders find this pair highly important and attractive. The pair tends to become volatile and provide lucrative trading opportunities due to its fundamental nature of interest rate disparity in both currencies (AUD and USD).
AUD USD’s popularity among traders is unanimous. Since AUD became a free-floating currency back in 1983, it has become highly attractive. Other factors such as geology, monetary policy, economic stability, and geography are also factors that contribute to AUD USD’s attraction among traders. One of the other reasons that make AUD an attractive currency is that Australia is among the wealthiest nations in terms of wool, diamonds, valuable metals, wool, and meat.
Moreover, as Australia buys Gold in massive amounts, many traders go through and examine AUD USD rates in order to attain a robust prediction on Gold’s overall price movement.
Trade with confidence with exclusive AUD/USD Elliott Wave Forecasts
Why use Elliott Wave Forecast for AUD/USD Currency Pair?
Let our expert analysts help you trade the right side and blue boxes with timely and reliable AUD/USD forecasts.
- Daily & Weekly Technical Videos
- Live Chat Rooms
- Live Analysis Sessions
- Sequence Reports
- Free Education and Learning
- Live Trading Room Sessions
Don't take our word for it. See what our customers say
Ben
"Hello there. I’ve been trading and following Elliottwave-Forecast for a long time now. I first started noticing his trade calls and wave counts on twitter, that was before he opened his business of being a mentor and helper for us newbies to the forex market. Its been almost a year now and I can honestly say that Eric is a genuine professional person. He’s not here to rob people and give them false hopes. He wants to help anyone interested in taking the next step in enhancing any personal strategy with clear cut wave counts. Yeah he is not perfect, BUT no one is. He’s interpretation along with daily videos makes trading decision ALLOT easier. Im a day trader and having his Elliot-wave principal along with my strategy that makes trading far less emotional. It is in my 2 year experience of being a trader a must have essential to have a mentor and not having Eric or the Elliot-wave understanding is like flying without wings. All the best to anyone without the Elliot-wave understanding."

Mark Morrissey
"What a great service ElliottWave- Forecast is, James Eric make a great Elliott Waving Team and they certainly know their stuff. They offer a real thorough value for the money in an Elliott Wave service compared to the other EW sites on the internet. There signals are all very low risk and highly accurate. Eric and James are both excellent Elliott Wavers, and convey their EW interpretation of the market in a very clear and concise way. I would highly recommend this service to anyone with an interest in trading forex, wants to learn Elliott Wave or a Forex trader who wants to follow there signals blindly whilst getting a good handle of how to manage as a trader. Keep up the GREAT work guys!!!"
Zac Missler
"I have followed numerous Elliott Wave analysts and no one counts corrections better than EW Forecast. The intricate details matter in EW, and counting the intricate details often prevents bias from entering into Elliott wave counts and ultimately save clients money. I have an established system and I use EW Forecast to provide added probability to my trades. When my system and EW Forecast analysis agree, I trade larger and make more money on higher probability set ups."
Matthew Dixon
"You are definitely the best guys out there. You can use me as a reference any time !!"
Demetre | June 2012
"95% forex retail traders lose money. EWF gives you the insight, tools and the guides (charts) to ensure you’re one of the 5% who ‘make’ money. Last month (May 2012) with EWF’s insight my account increased 17.52% (net), and it was a difficult month to trade."
Grzegorz Szumański | July 2012
"I can go on and on and on about how good Eric and Daud are. So humble and so nice to deal with and never hesitate to answer any of my questions. I tried many services before joining Elliottwave-Forecast but was always dis-satisfied with either the analysis or attitude of service toward the clients. I wish I was allowed to share my live accounts results in this testimonial so I can show everyone how my account has grown exponentially after I joined this service. I highly recommend this service."
Naomi | June 2012
"I joined Elliott-wave forecast 3 months ago, and since then my confidence, consistency and profitability has transformed. The seminars and forums every day help to give a real unbiased view of the markets, the more you watch the more you learn. The Skype group is great, everyone helps each other,under the watchful eye of the Elliott Wave Moderators.For anyone who wants to take their trading to the next level, I wholeheartedly recommend joining Elliott Wave Forecast"
Jon KirkPatrick | September 2012
"Since joining EWF I have learned a wealth of information. I view the market in a completely different light. Eric and staff are extremely professional and are just outright amazing. In cases where I would of been short, I am now long. Since joining I have never been on the wrong side of the market. I would recommend anyone to jump on board with the trial plan to see for yourself. EWF is my new addiction."
Rich Wynes | October 2012
"I started trading SP and Russell 2000 ETFs in my Roth IRA a year ago. For nine months my results were positive but only fair at best. I started using Elliott Wave Forecast in July of 2012 and now EWF is my new best indicator. Daud Bhatti and his team, along with RSI and slow stochastics, help me identify tops and bottoms with nearly pinpoint accuracy."
Pekka Turpela | November 2012
"As someone new to trading I noticed Elliot Wave Forecast on the social media Twitter. I was amazed how different and accurate their application of the Elliot Wave principal was. After joining I quickly realized that I was dealing with experienced and skilled analysts who also to my surprise are extremely humble and friendly to all members. I have found their analysis to be consistently highly accurate and reliable. The unique thing about Elliot Wave Forecast is that their goal is also to teach traders to become knowledgeable, skilled and profitable. All this is accomplished in a daily interactive atmosphere between members and analysts that feels like a family. I think this combination is truly unique and highly recommend joining this service."
Steve | November 2012
"EWF is like a breath of fresh air in the trading mentoring market! Eric and Daud are spot on the mark with their trading and share their advice and trading ideas in a professional and friendly way. This is not a Signal Service – it is much better – you learn to trade for yourself but have the benefit of the guys to help you. You can ask any question in the Skype room – no matter how simple or daft – and I should know! ? I have never come across someone like Eric who must spend 18 hours per day trading and helping the EWF members at the same time! I can’t recommend EWF highly enough!"
Meneem Kiwan | December 2012
"I am a dedicated trader and have always been member of various trading societies, but EWF is different. Recommended by a Professional, I found impressive people behind it,prompt valuable system, clear specific details ahead of the market at all times. A recommended experience to every professional trader, where you find a wealth of information."
Roger | March 2013
"I am new to trading and Elliott wave but since joining Elliottwave-Forecast, I have learned a lot and keep on growing my account month after month. I can even make my own trading decisions based on all the education and tips that I receive from moderators in 24 hours a day chat room and live screen sharing sessions which I believe are a unique feature of this service. I would highly recommend it if you wish to improve your learning and be profitable on a consistent basis."
S Morris | October 2013
"Extremely impressed by Elliot Wave Forecast. They don’t just offer signals but a whole education in Elliot Wave theory. Unlike some other services the admin/moderators are genuine, available 24/7 and go that extra mile to help improve your understanding. After just 2 weeks, my account is up 4% and my understanding is up by 100%. Within 2 days it paid for itself."
Elba | June 2013
"Thank you Elliottwave Forecast Team for making me a better and professional trader and separating me from the retail crowd. I was having losses after losses until I came across this website through google search. Very professional and honest team of analysts who don’t have a bias. They try their best to keep clients on the right side and hence profitable. Highly Recommended."
Hassan Abdal | September 2013
"My experience in trading is 7 years and 4 years I used Elliottwave to trade the market above that I registered in alot of online forecasting website none of them make my equity rise but with EWF is different the only guys knows how to read the markets and they always with the TREND with them my equity expansion not just that the way that the communicate with members and keep everyone update 24H !! anytime you need them they are there for you !! they give you more than and alot of what you pay !! very professional forecasting and I REALLY REALLY recommended this service for everyone that want to be a winner!!"
Mike R | January 2014
"I’ve been a Forex trader for almost 15 years. During that time, I wiped out my account completely twice and nearly a third time. My position sizing was nearly always wrong, my trades were always early or late but most of all, it seemed I was always on the ‘wrong’ side of the trend. Always. As the years progressed, so did my trading. In 2010, I actually turned a (small) profit and felt pretty motivated. In 2011, I made the commitment to do all I could to learn more about being on the correct side of the trend. Since I have a full-time career outside of trading, I began searching for an ‘advisor’ of sorts. I had heard about Elliotwave and wanted to know more. After researching many different subscription services geared to FX, I decided to go with Elliotwave Forecast. It’s a bit hard to put into words the magnitude of shift that occured in the following three months. I started making money. Consistent money. Every month. I really began to move from ‘hoping’ to ‘trading’. I was on the right side of the trend. Finally. Jump ahead to now- 2014. We just finished up an extraordinary year in the markets. My trading income exceeded what I make in the ‘profession’ that I have been involved in for 20+ years. Now let me get something straight- not every trade setup was a winner. They never are. But I can say one thing with absolute certainty–it has changed my life. I’m on the right side of the trend. Just to be clear, I contacted EWF and asked to write this testimonial, not the other way around. I’m not getting paid to do it. It comes from the heart. Trading comes from the heart. You owe it to yourself to give them a shot. It may change your life. Kind Regards and Happy Trading"
Muhammad Waqas | November 2014
"I started trading 4 years back and after nearly completely wiping out my account in 1 year i found Elliott Wave Forecast luckily .The best thing about EWF is that they will transform you into a professional technical analyst , they simply don`t give you the fish they teach you how to catch one , daily technical videos , charts updated 4 times , trend trading in 4 Hr Charts , Daily 2 Live Sessions , 24 hours chat room , forecasting simply at its best . The experience is simply awesome when instead of hoping to earn money you are actually earning money , been with them for 3 years will probably be with them as long as i can . Conclusion they are not here to rip you off like most of the services are doing , they are here to teach and make us better traders"
Masataka Wada | June 2016
"Thanks for being such a great guide in the Forex/stock index arena. I have been a subscriber for almost 4 years and you are no doubt one of the best, especially mid to long term forecasts, and yet striving for perfection. It was eye-opener to learn how instruments/markets are correlated each other and finding the correlations can lead to successful trades. Keep up the wonderful work."
Abid Khan | June 2016
"I joined EWF to learn the practical application of EW theory. The Analysts are all awesome. I truly appreciate Eric, Daud, Hendra and EWF team’s devotion and time. Their work presents the scientific and objective approach to market forecasting with the Elliott Wave Theory. Their live sessions are educational and they teach real-time application of the Elliott Wave Theory to the charts. The chat room is available 24 hours to answer member questions.Eric has greatly expanded upon and refined the concepts first discovered by R.N. Elliott. Every day in live sessions, Eric and his team present these concepts in a logical, step-by-step fashion in the actual order they should be applied to a chart. The EWF live sessions, Trend Reports, Proprietary Pivots and 1 hour, 4 hour, Daily and Weekly charts(updated regularly) for 50 instruments really sets EWF apart. EWF Team, I truly am impressed with your unbiased analysis. I highly recommend EWF if someone has a passion for both a greater understanding of the dynamics of price action and an ability to accurately forecast future price action, the EWF team will help to achieve that goal."
Brad Thorp | August 2015
"I think your service is fantastic and I love it. I have been a member for over 1 1/2 years now and you have turned me into a profitable trader. Prior to this I was break even at best and managed to blow a couple of accounts but I have now doubled an account and I’m on track to do this again all by listening and applying principles taught by EWF. I find your service totally professional and always trying to help traders as much as possible. The charts are clear and concise and explanations easy to understand. Thank you for the effort that the entire team puts in."
Roman Attali | August 2015
"EWF Team have open my eyes on what trading is all about. Its like if three quarter of what i have learned before to trade have no sense. Have push my trading very far better than what it was and my progression is huge with EWF Team. These guys are really fantastic . I would strongly advise any friend or anybody who want to be a winner in trading to use EWF Service."
Francesco Cardinale | June 2016
"I am have trading for almost 6 years. I was using several strategies for swing trading on Forex, Stock Indices and commodities. In my trading carrier, I quickly realized that free launch doesnt exist and the success can come only after hard study and hard work. I soon realized how much classical indicators are only able to explain what happened in hindsight but not very good at forecasting the future path. Learning from EWF educational seminars was extremely useful for me because the content of these seminars provide specific gears for specific market situations and allows me to improve a lot my forecast capability, to identify precise and high probability trade entry context, to define great Risk/Rewards and thanks to well identified stop loss and target areas as to maximize the profit of each trade through Waves/RSI/StockRSI analysis. On top of this, the subscription service is great because it allows me to get confirmation of my own analysis, reduce a lot of losing trades and continuously improve my own market understanding and personal market analysis capabilities at the same time. I believe a good trader carrier to have the main legs consisting of improve a traders technical skills and improve a traders confidence in him/herself and their plan. EWF seminar + EWF subscription are great on improving boths legs ! In conclusion, I strongly recommend EWF seminars study and the related subscription to market forecasting services."
R.L Wong | June 2016
"Since first day I subscribed at Elliottwave-Forecast,Ive been watching improvements on my trading, as they work much as possible in order to deliver you not only awesome and high-accuracy, but education materials and live sessions, or webinars, that give you an in-depth view of how really the market moves. Also, I would like to note that their 24 hour chat is highly helpful, with analyst giving you fresh updates of the market, specially when there are volatility on the air and when its needed, they notify you about adjustments in real-time. When you pay for this service, you start to see and analyze the market with a never-seen outlook, which you wont find in another forecasting services, because Elliottwave-Forecast REALLY does what they tell you in their slogan: make better decisions. Thanks to EWF, also, Ive been trading several instruments which I had fear to trade, as I didnt know how to analyze them, but when you find that there are correlations in the markets, something that EWF teaches you, absolutely you erase that fear from your trading day!"
PANAGIOTIS KALOFOLIAS | June 2016
"I have been in trading business for 8 years. I have to admit that my starting point as a trader was pretty bad as I did all the beginner mistakes one can possibly do and received several margin calls on prior accounts. Then I read about Elliotwave methology and it piques my curiosity, so I decided to try several different service provider at the beginning. Unfortunately I was disappointed as these service didn’t provide me any good market insight and I still continually failed. I kept searching for something better until I came up with EWF. In fact, I was ready to quit from trading if it didn’t work out. EWF really transformed my mindset as a failed retail trader to a professional one. They turned me from one of the 95% people losing money, to the 5 % traders who make profits consistently each month. EWF provides a clear well tested method with strict rules, and if you follow it to the letter, it can make you become a successful trader in no time. EWF is not a cheap useless signal service but you can learn how the market works and how to correlate different trading instrument for a more accurate forecast. Last but not least, I need to admit that being almost in every live session every day made me produce profits even easier.In conclusion, this service in my opinion is the best among all available ones in the market and I would recommend it without second thought to anyone who wants to transform himself into a professional and profitable trader and also to traders whose target is to work in a hedge fund."
Rohan Pendharkar | June 2020
"Just wanted to thank the entire team for awesome charts. I’ll subscriber for life. Thank you again!!!"
Caliphtrading | June 2020
"I am recommending everyone to join the family at Elliotwave Forecast. Knowing what the market is doing, understanding where the price is heading, what to do, what not to do, the right side of the market, those are the few things that you will learn from the team."
Brandon Olson | Jan 2021
"I have been trying to fine tune trading for the past 6 years and was not making any progress. I tried and used signals, and spent a lot buying educational material. But the truth is, I have not seen anyone explain the candlestick charts and their behavior the way they do at Elliott Wave Forecast. I am very relieved that I finally got them and the advice from EWF analysis is spot on. I can’t believe I’ve finally found the right place to learn and trade."
Jeremy Phelps | Jan 2021
"I subscribed to 4 educational seminars which were very clear and concise. It covered basics of elliott wave, trading seminars, structures and sequence of swings etc. I will definitely suggest it as if anyone wants to have a hands on skill in understanding charts and make better decisions in trading. With charts on elliott wave forecast i take decisions on my trading and it has changed my views of how the market works. I can now make better investment decisions and be profitable with my moves. The analysts are very friendly and most importantly know what they are doing. I am happy to come across Elliott Wave Forecast."
Donato Palmieri | Feb 2021
"Hi! It has been two years since I joined the EWF. In the beginning I was a bit confused as I was still learning but now very soon I started to see results. I don’t think I would’ve made it through without the help from EWF. I’m very satisfied as it has provided me with very good knowledge of trading. Graphs are very interactive and informative everyday. Their analysts have very good market and trading knowledge."
Edwardo Tellez | Feb 2021
"Outstanding site for educational content, trading information and live sessions. If you are serious about learning to trade whether you’re a beginner or expert, the talented and friendly mentors support you every step of the way! Worth every penny of membership and if you apply yourself to learn everything you can from these guys, you will get so much out of it! In just a few months my trading has transformed as a result of the learning I’ve been able to achieve through these guys. Highly recommended!"
Sean Goodwin | Feb 2021
"Choosing Elliott Wave Forecast is the best investment decision I’ve made in my trading career."
Matthew | Nov 2021
"I really enjoyed the Indices Webinar although I had to leave early and missed over half of it. Your company really sets itself apart from “The EW Wannabes”! If the Webinar is online I would love to watch the remainder of it. On another note does anyone know if Ralph Nelson Elliott has any living relatives? I am sure they are honored that EWF has taken his work to new heights! Keep Up The Great Work!"
Roshan | Nov 2021
"Webinar was excellent. Most importantly your market analysis forecasts are always accurate and correct. I do remember; Covid crash March 2020; your recommendation forecast was to buy the Indices. You were correct and you are the best in the world."
Mark Casburn | Apr 2022
"I just want to say how happy I am that I found your service. Robb is absolutely amazing! I feel lost on the weekends because I can’t listen to his seminar. At least I have the weekend update. I am making money and liking every minute of it. Keep up the good work. Thanks to all of the people that man the chat room. They are responsive to any question and provide real valid explanations. I have tried other services and watched their staff argue about the count. Not here! Again, Thanks for all the great work."
Brian Summy | Sep 2022
"Outstanding forecasting. This company has genuinely taken my trading to the next level. 1 key, whatever plan you choose, when starting out, you really need to add on the Live Analysis session for a few months. It’s 2 hours a day of coaching and the sessions are recorded if you cannot make the webinar. It’s like a professional trading class M-F. Forecasts will change as the market moves but the live sessions teach you their mindset and help bring this all together. I am glad to have found them and am now a funded trader with my prop firm due to EWF’s planning."
Miloslava Mazancova | June 2023
"I have been trading Forex for last 5 years and lost so much money. Since I subscribed to EWF last year, I have been consistent with my trading and being on the right side of the market. As of today, I profited $56,258 since being a member of EWF. This is just a beginning. I’m slowly getting to understand the market with your guidance. Thank you so much!"
Christopher Hudson | Jan 2024
"Elliott Wave Forecast has been a trusted source of advice and guidance in my investing efforts for a decade. It is a tremendous advantage to have a skilled team of professional analysts working with me not only to identify successful trading opportunities, but to learn how the market works! I trust EWF and I believe they honestly care about their investors having success in the markets."
Viviansh | Jan 2024
"Very good to learn this EWF approach to forecast the market! I recommend it to everyone!"
Minhui | Jan 2024
"The seminar is very informative regarding the big picture of the market. I recommend anyone who is interested in financial sectors get to know about the Elliott Wave. Also, compared with other Elliot Wave analysts, Mr. Eric Morera is the best one so far."
Bryan Guguen | Feb 2024
"Elliott Wave Forecast provides a brilliant service for those who needs further confirmation of the trend and direction to trade. Very useful to compliment anyone’s existing strategy to improve on existing edge. I highly recommend their services."
Y Sheen | Feb 2024
"Been a member for 2 years now, great service, comparing with all other services i tried over the years, this is the most surprisingly rewarding one by far."
Cherry Wong | Feb 2024
"A systematic investment guidance. They also have chat room for us to ask questions and they are willing to teach us the technique ie not only give us fish but teach us how to fish."
David Pettus | June 2024
"The Elliott Wave Forecast team does a fantastic job at educating their clients on Elliott Wave theory and explaining the near term and longer term probabilities for market direction based on their analysis. Their services are a strong compliment to my overall investing and trading strategy."
David Mutty | June 2024
"I have known Eric and Daud since the very beginning, decades ago. They are thriving and so are their subscribers including me. I am still here, regardless; I know every service worth their salt but this crew stands at the top because they have a system that works and they have heart, this team truly cares about your success. Learn the system and it’s rules and you will gain the consistent wealth that they can prove in their live trading room performance archives. Learn the system, participate in live sessions and daily webinars, take some courses and you will succeed, sincerely, David Mutty"
Blaine | June 2024
"Follow their strategy, and no doubt you can be successful, best trading group joined. All pros and prompt response to inquires."
Kevin Fehderau | June 2024
"EWF provides an invaluable experience to the trader when it comes to trading stocks, futures, forex, even cryptos! Forecasting services are offered in structured tiers of products, and I highly recommend choosing a package that includes real-time conversation with their experienced analysts. They provide multiple updates per day, live market walk-throughs, and have decades of trading experience. You can be a day trader, swing trader, or long-term investor and do well with EWF. Hassan is one of the extremely talented real-time analysts and provides exceptional feedback and wave theory examples to learn from! His forecasting guidance has garnered large daily gains for 9 of the last 10 trading days."
Sabbir Momin | Aug 2024
"I have been a customer of this company since almost 2 years now and trust me it has changed the way I used to trade the market.Their trading strategy is absolutely safe and profitable almost 99% of the time. and the best part I love about my subscription with this company is live chat room which is available 24*7 which helps us understand any sort of issue.also they provide us with 5 Elliott wave chart per day of all the in addition to 1 daily chart and 1 weekly chart instruments I would strongly recommend."
WASIM KETIT | Oct 2024
"This is the first time I do something for myself. It is nice to join this group. They are the best traders on earth. Thank you."
Nono | Jan 2025
"Very rich materials through charts, videos, signals and forum to consult experts. Detailed analysis on various time frames, good percentage of the signals success, daily videos with analysis, good application of elliottwaves."
Thomas | Nov 2021
"If you’re a swing trader sign up with Elliott Wave Forecast. They really helped me become more professional and I see myself having better understanding of the market.. Following the rules of Elliott Wave for entering & exiting made me profits…"
Muhammad Umair | Feb 2025
"Accurate Forecasts & Great Support! I’ve been using Elliott Wave Forecast for a few months now, and their market analysis is spot on! The daily updates and live sessions really help me make informed trading decisions. Customer support is also excellent—always responsive and helpful."
Dsel | Jan 2025
"Glad I found them! I’ve improved a lot since joining the service. The analysts have deep market knowledge, and their trading signals are quite reliable, i would say around 70%. The system and services are solid, but they focus entirely on technical analysis, so fundamentals aren’t really part of the discussion."
Daniel | Feb 2025
"Rejoined After a Break – Much Better Now I was a member a long time ago when the service was quite different. Back then, they only covered one group of instruments, had one chat room, and about five analysts, if I remember correctly. The Elliott Wave analysis was good, but they didn’t provide trading setups, which was my main concern. They also didn’t cover the stocks and indices I was interested in, so I decided to look for trading setups elsewhere. Last year, I came across their service again and decided to give it another try. I’m glad I did. The service has evolved significantly, with many more analysts now, although the main team is still there after all these years. They provide trading signals that work very well, and the system is much easier to follow. I find the blue boxes and right-side stamps on the charts particularly helpful—they make the setups clear and easy to understand. The support in the 24-hour chat rooms is also excellent. I once spent almost an hour with one of their technical analysts, who patiently explained complex Elliott Wave patterns and showed me how to use the Fibonacci extension tool. I was debating whether to give them 4 or 5 stars because some analysts don’t have perfect English accents, but it wouldn’t be fair to give less than 5 considering all the support I’ve received. They are always professional and polite, and their trading setups have worked out well for me more often than not, which is ultimately what matters most. Also, I recommended it to my friend, who is now using the service as well."
Vld | Feb 2025
"Worth it if you have realistic expectations At first, it took me some time to get used to their trading system, it was quite challenging I must admit. However, over time, they improved the chart labeling and released some educational videos that explain the strategy. Now, I find the charts much easier to trade. I’d say it’s important to have realistic expectations. You won’t get rich overnight, but the strategy works in the long run. I especially appreciate that all live sessions and webinars are recorded, so I can watch them later if I miss them. The 24-hour support in the chat room is also great—you can learn a lot if you stay engaged. Their technical analysts are always available, and you get help quickly whenever you need it. If you use the service, here’s some advice for newbies: don’t try to be smart and trade every single chart they present. Instead, focus on the setups they highlight in the live trading room or at least ask the analysts in the 24hour chat room for their recommendations"
Keara Lakin | Jan 2025
"

AUD/USD Forecast using the Blue Box Approach
Blue boxes are one of the few terminologies and technical systems that we use for analyzing our charts. It is one of the widely used boxes by our analysts at the Elliott Wave Forecast. It is designed to allocate high-frequency inflection areas of interests, which allows the traders and investors to buy or sell a currency pair, crypto, commodity, or stock at the right time with precision while being on the right side of the trend.
Learn to trade the right side with blue boxes.

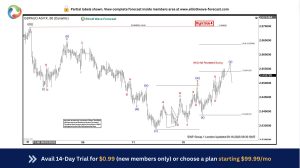
AUDUSD [28 January 2021 10:15 GMT]
Price reached a blue box, due to green right side tag and blue box, our members knew it was a buying opportunity and should resume the rally or produce 3 waves reaction higher at least from the blue box

AUDUSD [28 January 2021 19:15 GMT]
AUDUSD found buyers in blue box and rallied 100+ pips within the next few hours allowing traders which entered in the blue box to eliminate risk on the trade
AUD/USD Forecast, News & Analysis
Check our updated for AUDUSD News including real-time updates, forecast, technical
analysis and the economic latest events from the best source of Forex News
GBPAUD Elliott Wave : Calling the Decline from the Equal Legs Zone
Hello fellow traders. In this technical article we’re going to look at the Elliott Wave charts of GBPAUD Forex Pair published in members…
Read more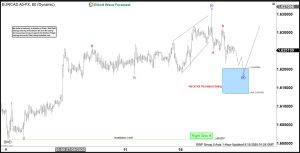
EURCAD Bounces Back: Reaction Higher from Blue Box Area
In this technical blog, we will look at the past performance of the 1-hour Elliott Wave Charts of EURCAD. In…
Read more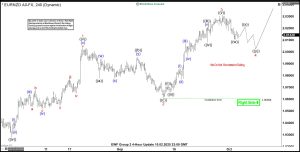
EURNZD Analysis: Bullish Sequence Targets Further Rally From Lows
Hello traders and welcome to a new blog post. In this one the spotlight will be on the EURNZD currency…
Read moreAUD/USD Forecast & Signals
At Elliott Wave Forecast, we use various technical tools that help us analyze the market more proficiently and take precise and accurate entry orders. Some of our technical and analysis tools include Elliot wave structures, market correlations, Fibonacci, trendlines, market dynamics, and sequences. Such technical tools help us analyze the market with extreme precision and allows us to stay on the right side of the trend. The right side is a terminology used at Elliott Wave Forecast, and it refers to the overall trend’s direction and our rhetoric about the market’s trend. For example, if we call the trend right side, we call out the specific direction of the trend (bullish or bearish). This allows us to give our traders highly probable AUD USD Trade signals.
")
AUD/USD Technical Analysis
As AUD USD is the fifth most traded pair on the forex market, it brings with it tons of volatility and volume. Thus, the trendy nature of the pair. One of the most powerful tools in trading trendy markets is Elliott Wave Analysis. It helps analyze historical market waves and anticipate more significant potential moves to occur in the market with extreme precision and exact entry points. The system that Elliot Wave Analysis brings with it includes wave structures, cycles, sequences, and correlated sequences. It is one of the most used technical tools in the forex market. It can be used on any market, including crypto! However, as many investment banks suggest, your trading plan must include a variety of confluences, and you must not rely on one technical indicator. For this reason, using Elliot wave analysis as a sole indicator for your trading decisions can be a failure.
Blue Boxes
Our top traders orchestrate blue boxes at such areas of the charts where there are higher probability and chances for either a trend continuation or trend reversal towards our desired targets. Moreover, the blue boxes include and represent the 3,7, or 11 swings to end. Our analysts also use blue boxes for a variety of reasons, as it consists of the use of Fibonacci extensions in its orchestration. It is used for attaining profit targets as well. For example, if we are in a trade and see a blue box forming up with high-frequency inflection areas and areas of interest, we will close our existing trade and get in a new trade that the blue box offers. It is one of our primary methods of trading the markets and contains a high level of probability.
Fibonacci
Fibonacci is the most understood tool; however, it is not used at its full effect. It offers high probability numbers where possible retracements and extensions of the trend may occur. For this reason, it is highly popular and essential among traders and investors. We at Elliot wave forecast use Fibonacci as a confluence to our already existing trading system. For example, we use Elliot wave analysis and sequences in combination with Fibonacci extensions and retracements. This allows us to attain a more detailed view of the market and extreme accuracy.
Trendlines
In a nutshell, trendlines are one of the most popular technical tools among traders due to their easy-to-use nature. Notwithstanding its nature, trendlines are highly powerful and precise technical tools. Most of the traders use it as an added confluence for their entry or exit orders. We at Elliot wave forecast use it for a variety of reasons. One of the main reasons includes identifying the nature of the trend and its strength. We also use different indicators with trendlines such as RSI and distribution systems, and it allows us to create a trading system with trendlines that is highly probable and precise.
Market Correlations
One of the most prominent market correlations for the AUD USD pair is USD CAD, USD JPY, and USD CHF pairs. This is because the AUD USD pair has USD’s quote currency, while the other mentioned pairs have USD as the base currency. Our analysts utilize the first- and second-dimension correlation system to attain a more precise and accurate correlation of a specific pair across different asset classes. Having a correlation system as part of our trading plan allows us to make wiser decisions and elevate our overall trading style.
What Is the AUD USD (Australian Dollar/U.S. Dollar) Pair?
AUD USD is the short abbreviation, which is referred to as Australian Dollar and U.S. dollar. As a currency pair elucidates to the readers the amount of currency needed to buy 1 unit of another currency, the AUD USD exchange rate represents the amount of U.S. dollars required to buy 1 unit of AUD (Australian dollars). In this currency pair, AUD (Australian dollar) is considered the base currency, and the USD (U.S. dollar) is regarded as the quote currency.
Understanding the AUD/USD Pair
Basics of AUD USD include understanding its exchange rate. For example, if the AUD USD currency pair is trading at 0.7645, it would require over 0.7645 dollars to buy 1 unit of the Australian currency unit. The AUD USD currency pair is one of the most traded currencies in the forex markets. Many traders have given this pair a nickname, “Aussie.”
Basic Fundamental analysis of AUD USD
The AUD USD currency pair is affected by much fundamental news and other fundamental factors. Some fundamental correlations for AUD USD are the price of commodities such as (Gold, coal, iron ore, copper) AUD is a significant producer of metals. For this reason, when the price of metals is increasing, AUD USD also tends to increase. Other factors such as Employment data, GDP, and monetary policies are highly influential on the AUD USD trading pair, and they can significantly steer the overall movement of the pair. At Elliot wave analysis, we profoundly analyze correlations with different asset classes for this pair to provide our clients the best trading opportunities. However, we do not use any fundamental analysis, as we think that the price movements that occurred by fundamentals are already priced in. also, our professional technical tools allow us to determine such moves before their occurrences.
What is the best time to trade AUD USD?
In theory, forex pairs can be traded 24/7. However, there are times when market turnover happens (overnight) and times when there is very low liquidity (bank holidays, prior to significant news events, and political unrest). For this reason, it is crucial to understand the best trading hours for the currency pair you wish to trade. At Elliot wave forecast, we use a highly imperative system that allows us to understand the best hours for trading a specific pair. In general, the Aussie is most volatile between 19:00 and 4:30 (GMT).