RELIABLE OIL FORECAST
Daily Accurate Oil Trading Signals
1 Hour, 4 Hour, Daily & Weekly Elliott Wave Counts
Live analysis sessions and trading rooms
Daily technical videos, sequence reports & more…
Oil Trading Signals
Trade with confidence with exclusive Elliott Wave Forecasts
Oil is one of the globe’s most significant, highly capitalized commodities. Its price influences the prices of numerous other commodity markets, including diesel and natural gas. The repercussions of oil prices, on the other hand, affect the values of equities, currencies, and economies all across the world. Notwithstanding renewed importance in the oil and gas sector, it remains a vital sector for the globe.
Oil trading is purchasing and selling oil for a return, whether via physical exchange or trading the oil through various ways such as futures contracts, CFDs, and spot trading. Because of the volatility produced by fluctuations in production and consumption, the energy business is heavily lucrative.
Crude oil is considered one of the excellent commodities to invest in a futures market since the marketplace is bustling, and investors all over the globe are familiar with it. Crude prices can vary on the slightest murmur of economic data, the favorite choice of day, and position traders seeking an advantage. This volatility market does provide some excellent trading chances, whether you are a scalper, day trader, or relatively long trader. It may also lead to huge losses once you’re on the opposite side of the market fluctuation.
We at Elliott Wave Forecast understand that not everyone can be a financial expert but that shouldn’t prevent you from taking advantage of such rewarding opportunity.
Why use Elliott Wave Forecast for Oil?
Let our expert analysts help you trade the right side and blue boxes with timely and reliable Oil forecasts.
- Daily & Weekly Technical Videos
- Live Chat Rooms
- Live Analysis Sessions
- Sequence Reports
- Free Education and Learning
- Live Trading Room Sessions
Don't take our word for it. See what our customers say

Oil Forecast using the Blue Box Approach
Our Elliott Wave Forecast specialists often use the blue boxes specially designed high-frequency inflection zones of interest. These blue boxes are put on the chart in areas with a higher likelihood of either a trend shift or trend continuation, enabling us to stay on the right side of the trend! The blue boxes often occur in our graphs. Furthermore, the blue boxes show and explain the corrective sequence of the markets. It denotes the 3, 7, or 11 swings to complete, for example. It also includes some cycles and sequences that are often calculated using different Fibonacci extensions. Our blue boxes represent a buyer-seller connection in a particular geographic area. This enables us to coordinate our holdings in such areas since they are generally low-risk areas of interest with the potential of at least three swings in the trend’s direction.
Learn to trade the right side with blue boxes.
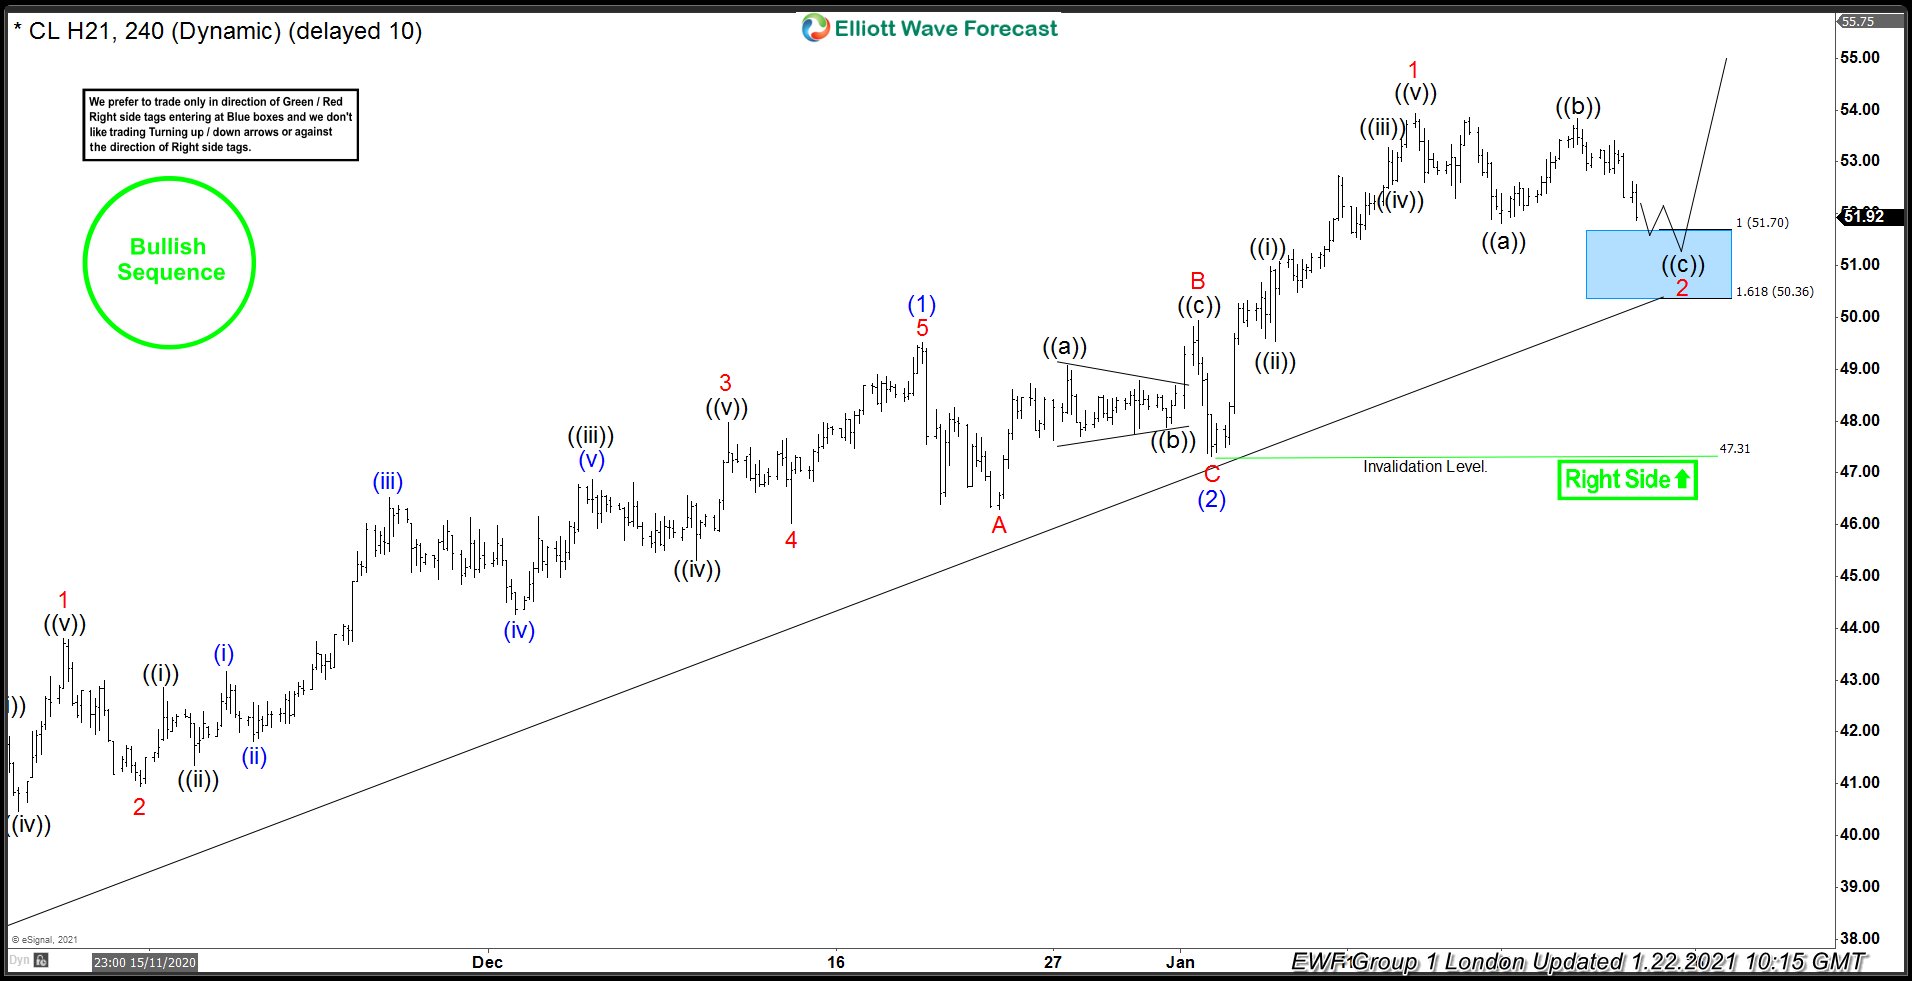
Oil [22 January 2021]
Chart shows Oil is in 3 waves pull back towards $51.70 – $50.36 before it resumed the rally or bounced in 3 waves at least. We expected buyers to appear in this area.
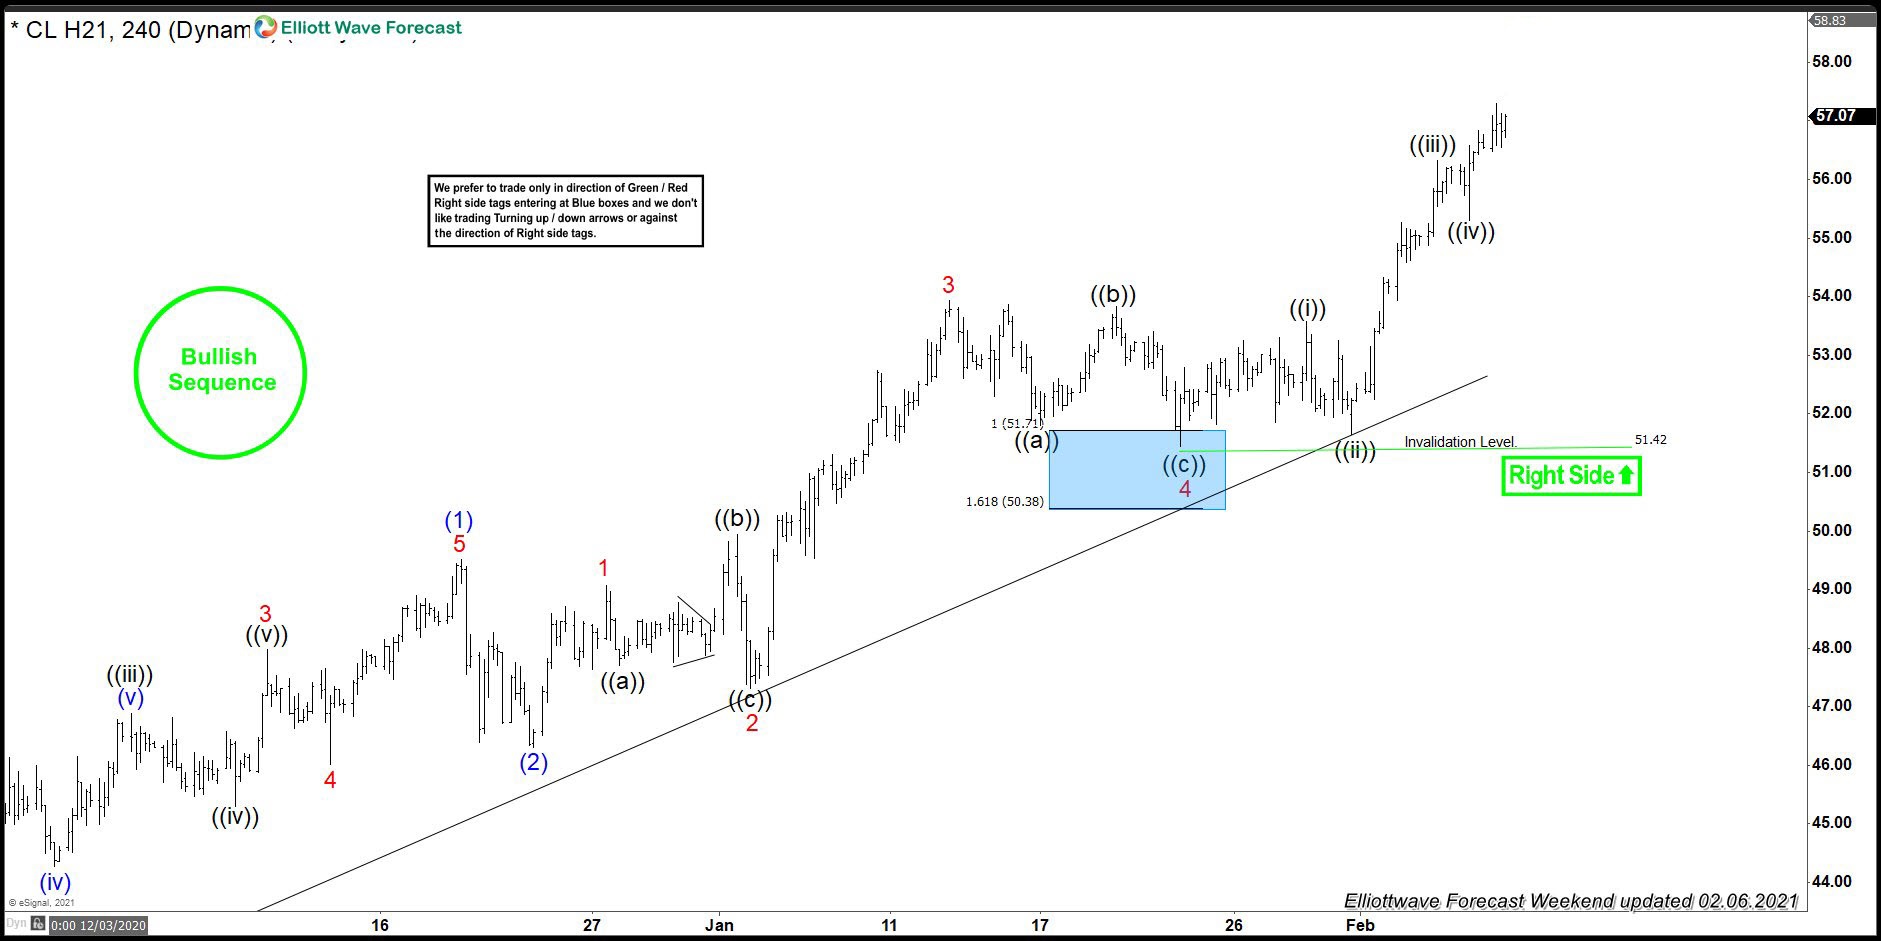
Oil [ 6 February 2021]
Oil found buyers in the blue box and rallied nearly $6 in the next couple of weeks producing nice profits for our members.
Oil Forecast, News & Analysis
Check our updated for Oil News including real-time updates, forecast, technical analysis and the economic latest events from the best source of Commodities News
Oil Forecast & Signals – How to Invest in Oil?
Oil may be traded using various ways, including trading Oil Futures, CFDs, and Oil Spot pricing.
CFDs on oil trading
CFDs may be used to trade futures contracts and market prices. When the contract matures, you will not be obliged to take possession of an instrument and will have the option to flip over existing current holdings.
Trading oil CFDs may be more cost-efficient than purchasing real futures contracts because you can establish trade for a lower cost – this is known as a leveraged position. Leverage may increase your earnings, but it can also increase your risk, so it’s essential to improve your risk correctly.
Spot oil prices for trading
Spot oil markets reflect the price per barrel if you purchased or sold it right then and there. It is a relatively brief trade with a near-instant payout.
The spot pricing is composed of two suitably liquid oil futures contracts, often the two with the closest expiration dates. Because these commodities markets do not expire, you will get ongoing oil prices without any need to shift your investment across.
Spot oil is excellent for reduced tendency trades and allowing you to do more in-depth technical analysis.
Futures trading in oil
Futures contracts are regulated contracts to trade oil at a specific price on a predetermined date. The agreement is either paid at the moment of expiration or carried over to the following expiry date.
Because oil futures have been used to pricing energy markets, you will still be subject to the underpinning of oil futures whether you purchase or sell oil via other methods, including spot prices.
Oil Trading Technical Analysis
There are many ways to trade the Oil. However, confluence trading in conjunction with Elliott Wave Analysis works best for trading the commodity! Here are some of the techniques our professional analysts and traders use daily to trade oil.
Elliott Wave Analysis
Elliott Wave Analysis is a helpful method for traders who want to predict significant market movements in the future. Many traders and high-end investors utilize Elliot wave formations all around the world. Elliot Wave structures help you anticipate if a bullish or bearish wave will develop. Elliott wave analysis is an excellent technique, but it should not be depended on entirely. Elliott Wave Forecast employs Elliot Wave Structures, as well as other technical tools in our arsenal. Our specialists, for example, carefully analyze each currency pair, commodity, stock, or asset using a variety of technical methods such as market cycles, correlations, sequences, and market dynamics. This allows us to construct and choose potential areas of interest and target points for future market movements. This also assists us in being on the right side of the trend, often known as the “right side” in our Elliott Wave Forecast investing forums. Because the first rule of trading is to avoid trading against the trend, Elliot wave structures, sequences, waves, and cycles help us orchestrate interest areas in the form of “Blue boxes’ ‘ on our chart, enabling us to avoid trading against the trend. Trading against the trend may be hazardous to your account; it might wipe it out in an instant!
Fibonacci
Fibonacci is one of the most efficient and credible technical methods for predicting future price retracement and goal levels. Elliott Wave Forecast experts use Fibonacci extensions combined with sequences and wave analysis to provide you with genuine trend reversal or trend continuation areas of interest. Furthermore, our researchers heavily rely on the Fibonacci technical tool to predict possible price retracement levels and price extensions. Because oil is such a widely traded fungible commodity, Fibonacci retracement, and extension techniques may be helpful in forecasting price movements and future target levels.
Trendlines
Trendlines are technical indicators that may be used to assess the strength of a trend. The bearish or bullish intensity of a price trend may be assessed by drawing a trendline from price high to lower highs or from price low to higher lows to ascertain the price trend’s strength. – A strong trend is defined as a trendline representing a significant inclination/slope in the price; otherwise, it is defined as a weak trend. When a trendline is broken, it signals that buyers or sellers are trying to break through a special price (depending on whether the trend is bullish or bearish). When a trendline breaks to one side or the other, it is seen as a strong signal that the price will continue to move in the direction of the break. Erroneous trendline breaks or trendline continuations (as described above) may indicate misleading breaks of continuations. Consequently, it is essential to use a variety of indicators in combination with trendlines to reinforce the signal with more confluences. To predict the conclusion of a particular cycle, Elliott Wave Forecast’s best traders utilize trendlines in combination with the RSI indicator and primarily depend on the unique distribution system.
Market Correlations
Oil has a long-standing relationship with gold. For example, if the price of gold rises or falls, the oil price tends to follow. As a result, it is essential to keep an eye on the Gold price fluctuation or potential movements to add an additional confluence in your trading strategy when trading Oil. Elliott Wave Forecast’s best traders and analysts use the idea of first and second-dimension correlations. Furthermore, our traders use a variety of correlations between this pair and other asset classes. This provides us with a competitive edge in making better-informed market decisions. It also helps us trade on the right side of the trend. This may assist you in meeting your trading goals and improving your overall trading strategy.
Oil Market Trading Hours
Most oil markets are open for trading and investing almost 24 hours a day. Nevertheless, sometimes the oil market is slow due to specific bank holidays or critical fundamental factors.


