RELIABLE DOW JONES FORECAST
Daily Accurate Dow Jones Industrial Average Trading Signals
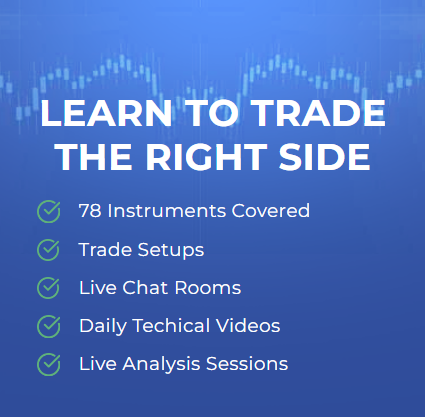
1 Hour, 4 Hour, Daily & Weekly Elliott Wave Counts
Live analysis sessions and trading rooms
Daily technical videos, sequence reports & more…


Dow Jones Trading Signals
Trade with confidence with exclusive Elliott Wave Forecasts
The Dow Jones Industrial Average (DJIA) is considered one of the widely followed indexes on the financial markets. The index is watched by millions of people daily; these people include traders, investors, and even viewers. Most novice traders/investors do not understand the actual representation of the Dow Jones Industrial Average. It was launched in 1896 and is known as the second oldest index in the entire history of the USA. The DJIA consists of over 30 large companies with a market cap initiating from $8.2 billion.
Trading and investing in the Dow Jones is not simple. It is one of the hardest indexes to trade due to its volatility being high. The goal of an index trader should be being on the right side of the trend and having proper risk management. A successful trader/investor has robust risk management that provides longevity in the financial markets. Don’t get me wrong. Financial markets can be ludicrous when it comes to making bad decisions. You can blow your trading accounts in seconds if you are not vigilant enough with your risk management. The key to trading the volatile index, such as the DJIA, is to have a proper and defined trading strategy that includes all variables such as risk management, trade management, and rules for trading. Applying the trading plan for a more extended period of time will enable you to attain a reasonable win rate and longevity in the financial markets.
Your risk management should be comprised of four parts:
● Small Losses
● Small wins
● Big wins
● Breakeven
We at Elliott Wave Forecast understand that not everyone can be a financial expert but that shouldn’t prevent you from taking advantage of such rewarding opportunity.
Why use Elliott Wave Forecast for Dow Jones?
Let our expert analysts help you trade the right side and blue boxes with timely and reliable Dow Jones forecasts.
- Daily & Weekly Technical Videos
- Live Chat Rooms
- Live Analysis Sessions
- Sequence Reports
- Free Education and Learning
- Live Trading Room Sessions
Don't take our word for it. See what our customers say
Emily T.

Alex R.
Sarah M.
John D.
This is testing for now
Edwardo Tellez

Dow Jones Industrial Average Forecast using the Blue Box Approach
Elliott Wave Forecast’s analysts and traders orchestrate high-frequency inflection areas of concern, where there is a greater chance of buyers and sellers agreeing to move in a particular direction in the future. This allows one to orchestrate precise entry points and determine if the pattern will persist or whether a turnaround will occur. These high-frequency inflection areas or pinpoint entry points are denoted at the Elliot wave forecast and referred to as “Blue Boxes.” Furthermore, the blue boxes characterize and reflect the 3,7, or 11 swings to finish. Likewise, the blue boxes are orchestrated and curated by combining Fibonacci extensions with other technological instruments. These blue boxes represent high-probability, low-risk areas of interest that have the potential to extract at least three swings on the right side of the trend path.
Learn to trade the right side with blue boxes.

Dow Jones Industrial Average [29 Oct 2020]
Price was approaching the blue box and our members knew that 3 waves correction should end in the blue box after which rally should resume.

Dow Jones Industrial Average [10 Nov 2020]
Dow Jones Industrial Average founds buyers in the blue box as expected and rallied over 4000 points in the next couple of weeks producing nice profits for our members
Dow Jones Forecast, News & Analysis
Check our updated for Dow Jones Industrial Average News including real-time updates, forecast, technical analysis and the economic latest events from the best source of Trading News
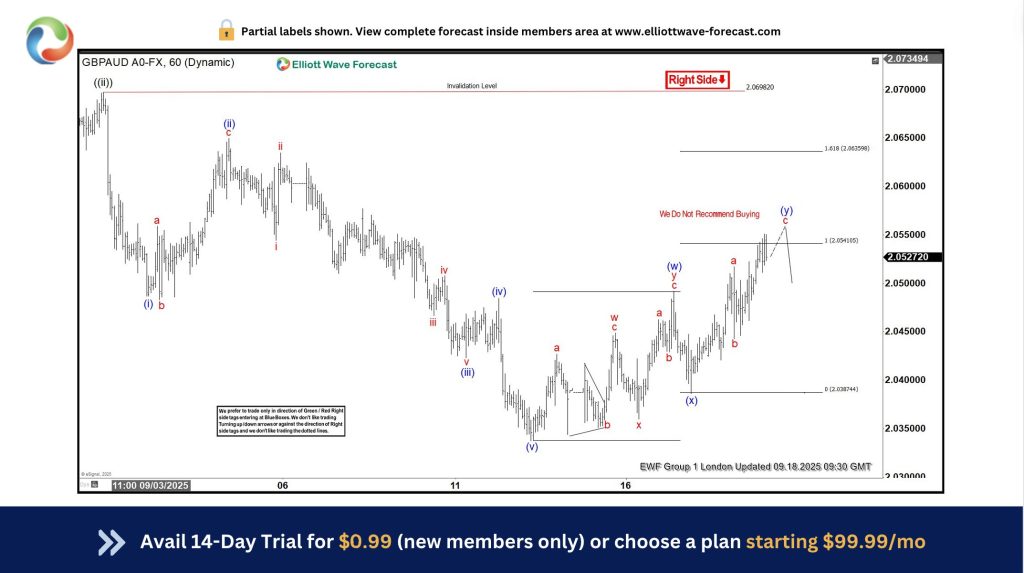
GBPAUD Elliott Wave : Calling the Decline from the Equal Legs Zone
Hello fellow traders. In this technical article we’re going to look at the Elliott Wave charts of GBPAUD Forex Pair published in members area of the website. As our members know, GBPAUD has…
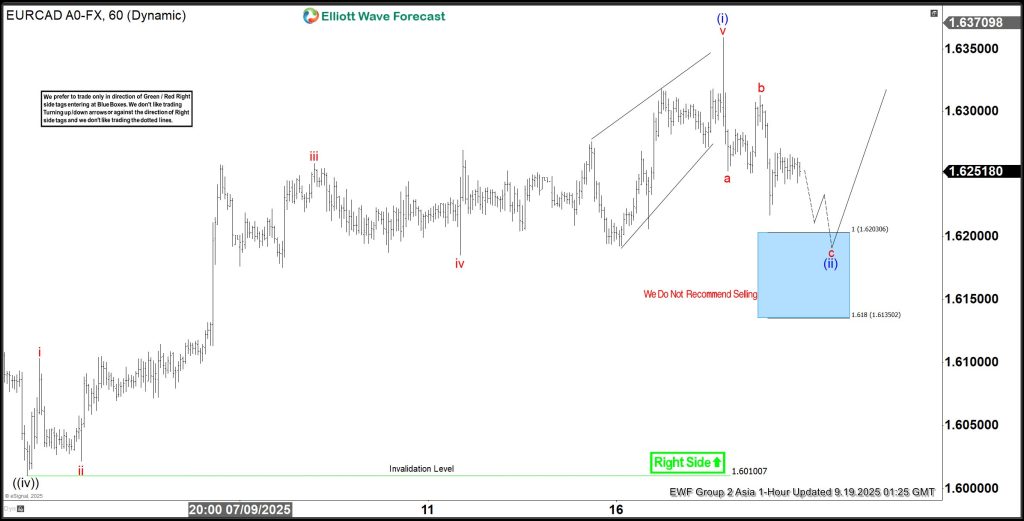
EURCAD Bounces Back: Reaction Higher from Blue Box Area
In this technical blog, we will look at the past performance of the 1-hour Elliott Wave Charts of EURCAD. In which, the rally from 02 September 2025 low unfolded as impulse…
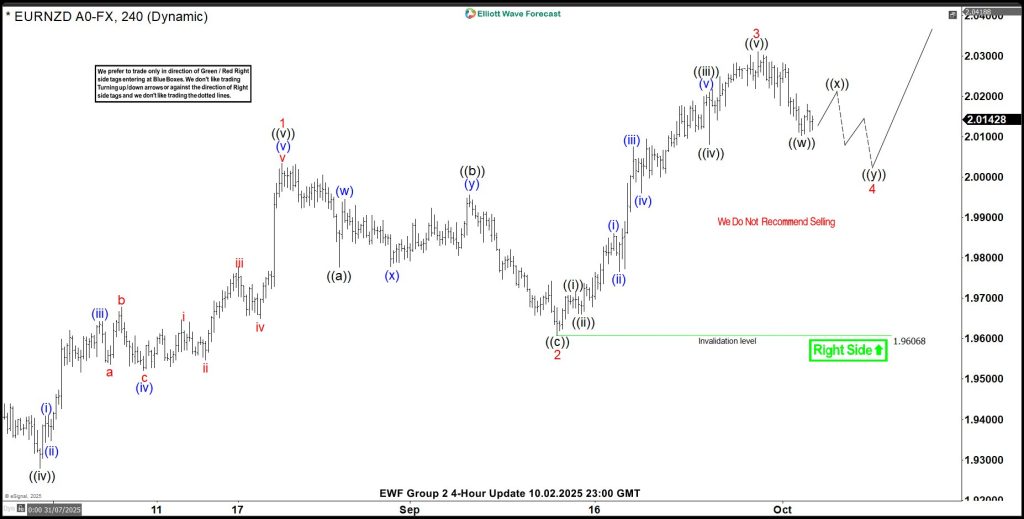
EURNZD Analysis: Bullish Sequence Targets Further Rally From Lows
Hello traders and welcome to a new blog post. In this one the spotlight will be on the EURNZD currency pair. This pair has been in a long-term bullish sequence…
Dow Jones Forecast & Signals
The Dow Jones Industrial Average (DJIA) is considered one of the widely followed indexes on the financial markets. The index is watched by millions of people daily; these people include traders, investors, and even viewers. Most novice traders/investors do not understand the actual representation of the Dow Jones Industrial Average. It was launched in 1896 and is known as the second oldest index in the entire history of the USA. The DJIA consists of over 30 large companies with a market cap initiating from $8.2 billion.
It is no doubt that many brokers provide trading the DJIA at all times; however, it is essential to know that the DJIA is most volatile around the US Equity market open. The US Equity markets start from 9:30 AM to 4:00 PM EST. This is the time when most traders/investors actively trade the DJIA index. Looking at history, this time has been the most volatile and profitable for the DJIA index traders.

Dow Jones Technical Analysis
Elliott Wave Analysis
Elliott Wave Forecast’s traders and analysts use a wide range of instruments and metrics to provide our clients with the latest and most informed, accurate trading decisions. Because of the pair’s high volatility, our traders use Elliott Wave analysis to make DJIA future predictions. Elliott Wave analysis is a critical instrument that allows traders to determine the general trajectory and pattern of a given market. It also enables traders to forecast massive price movements in advance of their occurrence. Our traders employ Elliot wave structure when performing Elliot wave analysis on a specific pair, index, or asset. The Elliot wave structures are pinpoint places that enable one to determine and forecast a significant market change or future wave.
Furthermore, this allows one to sit on the right side of the trend and avoid “trading against the trend.” Our traders realize that betting against the pattern can be very costly and dangerous to the accounts of inexperienced traders. As a result, we have created specific tactics that are in line with our clients’ personal competencies. Our services assist you in making money and teach you the principles and gist of proper technical analysis.
Furthermore, our traders use various methods, including market correlations, sequences, market patterns, wave structures, Fibonacci, trendlines, and Elliot wave analysis. Such technical frameworks and analysis allow us to thoroughly evaluate every forex pair, product, stock, or asset class while remaining on the right side of the trend. These tools will enable us to orchestrate and curate areas of the charts that have a higher chance of pattern continuity or trend reversal. These fields of concern are prominently labeled as “Blue Boxes.”
Fibonacci
Fibonacci is a technique that both high-end buyers and traders commonly use. Fibonacci’s existence is widespread, and traders may use it for scalping, day trading, swing trading, and even position trading. The Fibonacci tool assists you in locating particular areas of retracement and pattern extensions at a price. For example, if a trend is rising (making higher highs and lower lows), we will drag our Fibonacci tool from the trend’s low to peak. As a result, the golden Fibonacci number of 61.8 percent will serve as our primary retracement area for a further step to the upside. Fibonacci is commonly used in tactics such as “buy the dip” and “sell the rally.” Elliott wave forecast traders heavily rely on the Fibonacci in their technical arsenal. Fibonacci is used for a variety of purposes. For example, we use Fibonacci to determine possible retracement levels and profit target levels (by using Fibonacci extensions). We also use it to orchestrate the high-frequency inflection areas of our “Blue Boxes.” With Elliot’s wave forecast at your fingertips, the days of searching Google for “Dow Jones Signals” are long gone.
Trendlines
Trendlines are one of the simplest and most commonly used technical tools. Most traders use it because of its convenience and ease of use. However, most beginner or intermediate-level traders are unaware of trendlines’ ability or do not know how to use them properly. In a nutshell, trendlines are used to assess and comprehend the strength of a particular trend. For example, if the drawn trendline is steeper and more aligned, it indicates that the trend is powerful. If the trendline is less steep and not aligned at all, it indicates a prolonged trend. The trendline helps us consider the strength of the trend and makes better trading decisions. Elliott wave forecast analysts use trend lines as a point of convergence with a variety of technical instruments. For instance, we employ trendlines in conjunction with the RSI indicator and a proprietary distribution system. This enables one to determine the conclusion of a particular period.
Market Correlations
Trading Dow Jones with an existing correlation can be an excellent idea for most traders. Market Correlations give you an extra confluence and edge over the markets. They are pretty strong when making trading decisions. The Best correlation for the Dow Jones is gauging the Bond Prices. If the bond prices are rising, the Dow Jones index tends to go down, and when the bond prices are going down, Dow Jones appreciates. This inverse correlation sometimes works in prime market conditions.
