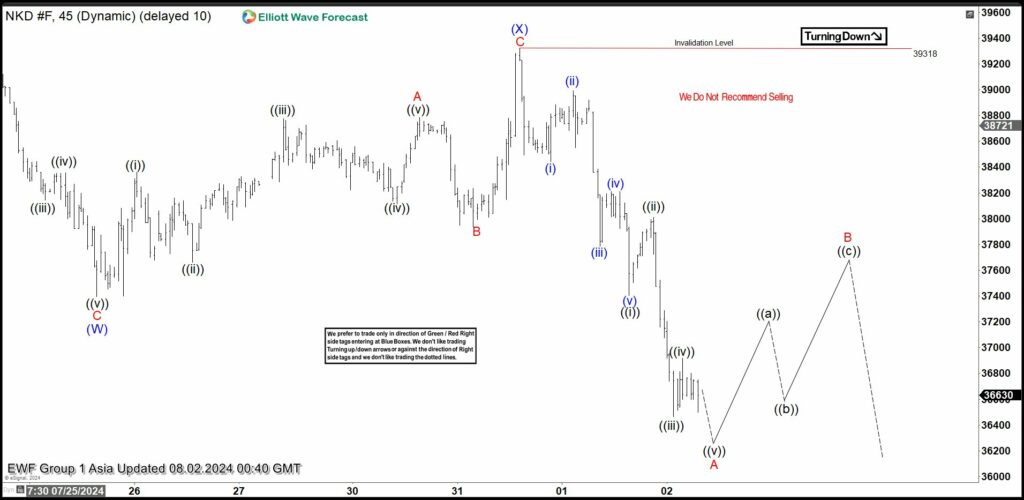
Short Term Elliott Wave in Nikkei (NKD) suggests the Index shows short term incomplete bearish sequence from 7.10.2024 high favoring further downside. Decline from 7.10.2024 is in progress as a double three Elliott Wave structure. Down from 7.10.2024 high, wave (W) ended at 37395. Rally in wave (X) ended at 39318 with internal subdivision as a zigzag structure. Up from wave (W), wave A ended at 38785 and wave B ended at 37395. Wave C higher ended at 39318 which completed wave (X) in higher degree.
The Index has turned lower in wave (Y) with internal subdivision as a zigzag structure. Down from wave (X), wave ((i)) ended at 37405 and wave ((ii)) ended at 38010. Wave ((iii)) lower ended at 36465 and wave ((iv)) ended at 36920. Final leg wave ((v)) ended at 36165 which completed wave A in higher degree. Wave B rally is in progress to correct cycle from 7.31.2024 high before it turns lower. Near term, while below 39318, expect rally to fail in 3, 7, or 11 swing for further downside. Potential target lower is 100% – 161.8% Fibonacci extension of wave (W). This area comes at 30932 – 34135 where buyers can appear for further upside or 3 waves rally at least.
Nikkei (NKD) 45 Minutes Elliott Wave Chart

NKD Elliott Wave Video


