RELIABLE EUR/JPY FORECAST
Daily Accurate EUR/JPY Trading Signals
1 Hour, 4 Hour, Daily & Weekly Elliott Wave Counts
Live analysis sessions and trading rooms
Daily technical videos, sequence reports & more…


EUR/JPY Forex Trading Signals
Trade with confidence with exclusive Elliott Wave Forecasts
There are many popular currency pairs available to trade on the foreign exchange market. Among them is one of the widely traded currency pairs regarded as EUR/JPY. The EUR/JPY currency pair denotes Euro as a base currency and JPY (Yen) as a quote currency. The currency pair represents the overall exchange rate of the EUR and JPY respective currencies. For example, if the EUR/JPY is 124.500, it will take 124.500 Japanese yen to purchase 1 unit of Euro currency unit. In its essence, the EUR/JPY currency pair elucidates over 3% of the daily transactions in the forex market.
Also, it is the 7th most traded currency pairs presented on the foreign currency exchange markets. The popularity of the EUR/JPY currency pair among investors and traders is unquestionable. Due to its high volatile nature, the pair provides lucrative financial opportunities.
We at Elliott Wave Forecast understand that not everyone can be a financial expert but that shouldn’t prevent you from taking advantage of such rewarding opportunity.


Why use Elliott Wave Forecast for EUR/JPY Currency Pair?
Let our expert analysts help you trade the right side and blue boxes with timely and reliable EUR/USD forecasts.
- Daily & Weekly Technical Videos
- Live Chat Rooms
- Live Analysis Sessions
- Sequence Reports
- Free Education and Learning
- Live Trading Room Sessions
Don't take our word for it. See what our customers say
This is testing for now
"This is only for testing"

Edwardo Tellez
""Outstanding site for educational content, trading information and live sessions. If you are serious about learning to trade whether you're a beginner or expert, the talented and friendly mentors support you every step of the way!""

EUR/JPY Forecast using the Blue Box Approach
The blue boxes are a terminology widely used at our investing forums and community groups at Elliott Wave Forecast. The blue box is a self-made term that denotes a technical phenomenon. For example, our traders and analysts create blue boxes by widely using high-frequency inflection areas that are profoundly designed in such a way where the market either tries to reverse or continues after touching it. The blue boxes often characterize the corrective sequences. For instance, they represent 3,7 or 11 swings to the end. It also includes a combination of different cycles and sequences that are usually calculated by using other Fibonacci extensions.
Learn to trade the right side with blue boxe

EURJPY [5 May 2021]
A 5-3-5 (Zigzag) Elliott Wave correction is in progress but needs 1 more low to complete the structure. Blue box highlights the area where correction is expected to end and rally to resume

EURJPY [11 May 2021]
Price reached the blue box where buyers appeared as expected and resumed the rally. Pair rallied 150+ pips over the next few trading days resulting in a nice profitable trade for members.
EUR/JPY Forecast, News & Analysis
Check our updated for EURJPY News including real-time updates, forecast, technical
analysis and the economic latest events from the best source of Forex News
Destra Network DSYNC Started New Bullish Sequence
DSYNC Destra Network is a decentralized cloud solutions project utilizing AI computing mechanisms and advanced technologies like IPFS and ENS. In today’s article, we’ll explain the daily Elliott Wave structure taking place and explore…
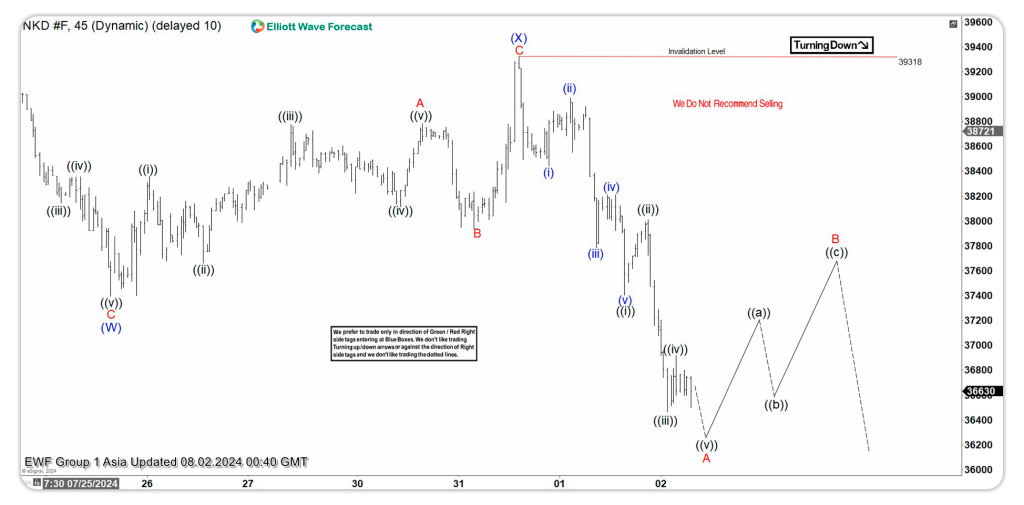
Elliott Wave Intraday Analysis Expecting Nikkei (NKD) to Extend Lower
Short Term Elliott Wave in Nikkei (NKD) suggests the Index shows short term incomplete bearish sequence from 7.10.2024 high favoring further downside. Decline from 7.10.2024 is in progress as a double…
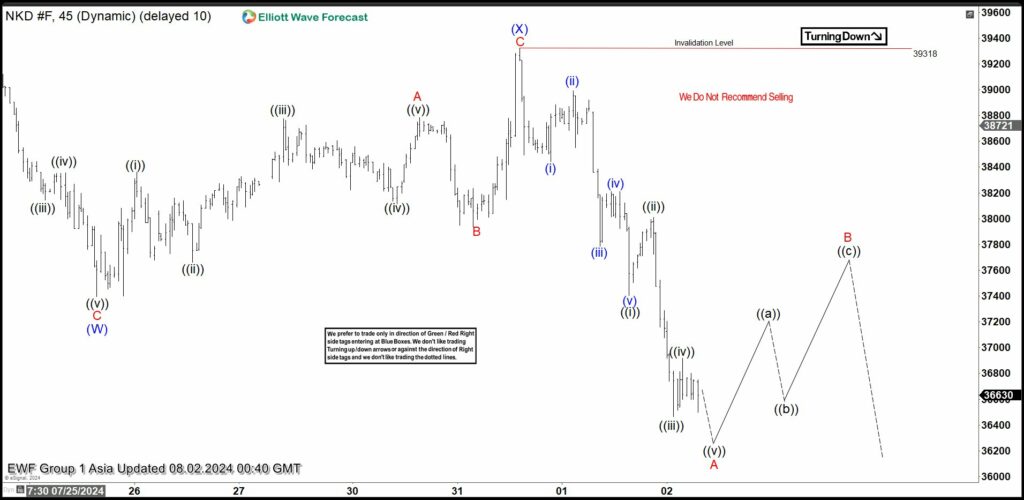
Nikkei (NKD) 45 Minutes Elliott Wave Chart
Elliott Wave Intraday Analysis Expecting Nikkei (NKD) to Extend Lower ZX Short Term Elliott Wave in Nikkei (NKD) suggests the Index shows short term incomplete bearish sequence from 7.10.2024 high…
EUR/JPY Forecast & Signals
EURJPY can be traded by using a wide variety of technical tools and indicators. Just as other asset classes and currency pairs, EURJPY is no different when it comes to technical analyzing the charts. At Elliot Wave Forecast, we use a wide variety of technical tools and indicators to gauge the future direction and overall movement of EUR/JPY. As our company’s name, our primary focus is utilizing the Elliott Wave analysis to understand the overall sentiment and direction of the markets effectively when it comes to analyzing the charts.

EUR/JPY Technical Analysis
Elliott Wave Analysis
Elliott wave analysis is one of the most widely used and powerful tools that allow traders to understand and gauge a particular currency pair, asset class, or stock’s overall market movements. It enables traders to understand the potential waves that may occur in the market before their actual occurrences. Our traders analyze the markets from a top-notch Elliot level and a birds’ eye view/perspective. Using Elliot wave structures enables our traders to anticipate potential bullish or bearish waves that may occur. It also lets us stay on the right side of the trend. However, our traders do not utilize the Elliot wave analysis as a sole tool for making trading/investing decisions, and you should not do it too. Trading with a single confluence can be risky and may result in a higher level of failure and reduced win rate; thus, affecting your overall trading results and performances. We at Elliot wave forecast utilize Elliot wave structures along with other profound technical tools and elements such as market correlations, trendlines, Fibonacci, sequences, and market dynamics. Using all of these confluences and technical factors helps us gauge the overall market direction better and enable us to remain on the right side of the trend and make better trading decisions.
Blue Boxes
Our blue boxes represent a correlation between buyers and sellers at a particular designated area. This enables us to orchestrate our positions on such areas because they are very low-risk areas of interest with a potential of market-moving at least three swings in the trend direction.
Fibonacci
Fibonacci is one of the most competent and credible analytical instruments for determining possible market retracement ranges and potential target levels. Elliott Wave Forecast analysts use Fibonacci extensions in conjunction with sequences and wave analysis to provide you with genuine reversal or pattern continuity areas of interest. In addition, our analysts make extensive use of the Fibonacci technical instrument to forecast future market retracement levels and trend extensions. Given the popularity of the EUR/JPY pair, Fibonacci retracement and extension methods can predict price fluctuations and future target ranges.
Trendlines
Trendlines are technical instruments that help you determine the strength of a trend. The bearish or bullish severity of a given market pattern may be determined by drawing a trendline from price high to lower highs or price low to higher lows in order to determine the price trend’s intensity. If the trendline defines a central inclination/slope in the price, it is considered the most robust trend; otherwise, it is regarded as a poor trend. When a trendline is disrupted, it indicates that buyers or sellers (depending on whether the trend is bullish or bearish) attempt to break through a specific price. When a trendline splits on either side, it is regarded as a good indication that the market will continue to rise in the break’s direction. Trendline breaks or trendline continuations (as explained above) may be erroneous and may indicate false breaks of continuations. Consequently, it is essential to use multiple markers in conjunction with trendlines to strengthen the signal with further confluences. Elliott Wave Forecast’s top traders use trendlines in conjunction with the RSI indicator and heavily rely on the proprietary distribution system to forecast a specific cycle’s conclusion.
Market Correlations
The overall EUR/JPY association is a significant correlation with USD/CHF. Often traders take advantage of the positive association between the two pairs in order to obtain better and stronger signals. Elliott Wave Forecast’s top traders and analysts use the idea of first and second dimension correlations. Furthermore, our traders employ various correlations of this pair with other asset groups. This gives us a competitive advantage in making more informed market decisions. It also assists us in trading on the right side of the trend. This will help you achieve your trading objectives and improve your overall trading style.
EUR/JPY trading hours
in theory, the EUR/JPY can be traded 24/5 on the forex markets; however, it is crucial to trade the currency pair when it is most volatile. As volatility and volume bring better entry opportunities. The pair is busy mainly from 7:30 to 15:30 (GMT).
EURJPY Fundamental Analysis
Factors influencing the euro-yen rate
This section will briefly explain the top factors that influence and indicate the EUR/JPY currency pair’s overall exchange rate. The geopolitics, natural disasters, economic consequences, fundamentals, and money supply of both the currencies (EUR AND JPY) affect and influence the pair’s overall exchange rate.
Role of EUR
The role of EUR in the overall exchange rate of the EURJPY currency pair is mainly related to the financial, economic, and political implications and elements. Sometimes these fundamental indicators can give false signals or provide signals that may already be priced in by the market; thus, we at Elliot Wave Forecast do not utilize fundamental in our overall analyses of pairs, asset classes, and other wide variety of tradable assets. Like most modern currencies, the major factors that influence euro prices are mainly economic, political, and financial.
However, it is always viable to understand the underlying factors that affect and move the overall market direction. Such underlying factors can enable traders and investors to gauge market movements better and understand the “Why” behind significant market movements. For this reason, trading the EUR/JPY pair, it is crucial to keep in check the European central bank’s monetary policy decisions and have an eye on other fundamental indicators such as GDP, inflation numbers, and overall trade balance. Geopolitical factors such as Brexit can also affect the EUR/JPY currency exchange rate. Thus, it is crucial to have an eye upon such releases as well.
Role of JPY
As JPY is a safe haven currency, factors such as geopolitics, economic uncertainty, market fear, and natural disasters can have a high impact on the overall exchange rate of EURJPY. For example, during high economic uncertainty, the money flows from Risky assets such as stocks, mutual funds to safer assets such as JPY and Gold. You may ask why JPY a safe haven is? It is because the economy of JPY is stable and is used as a hedging element when investors tend to invest in riskier assets.