RELIABLE GBP/JPY FORECAST
Daily Accurate GBP/JPY Trading Signals
1 Hour, 4 Hour, Daily & Weekly Elliott Wave Counts
Live analysis sessions and trading rooms
Daily technical videos, sequence reports & more…


GBP/JPY Forex Trading Signals
The GBP/JPY currency pair is the abbreviation of The Great British Pound versus the Japanese Yen. It is considered one of the most volatile pairs on the forex markets. Thus, the false breakouts and false signals are an everyday activity for this pair. Most investors and traders persuade novice traders to trade GBP/JPY as their first instrument because this pair can teach lessons very quickly.
As the GBP/JPY is a highly volatile pair, it can represent highly lucrative and profitable opportunities. Thus, it is popular among traders and investors. It can be highly beneficial and at the same time very dangerous. Trading GBP/JPY with tight stop losses and poor risk management can be cancer for your trading account. On average, the GBP/JPY pair moves more than 150 pips per day; thus, many traders are astonished by such high price movement and attracted towards it.
GBP/JPY can be highly profitable if traded with meticulous risk management and extreme care. The GBP/JPY currency pair’s average price movement is over 150 to 200 pips per day. For this reason, it is crucial to set wide stop losses and manage the risk wisely while trading this pair.
Trade with confidence with exclusive GBP/JPY Elliott Wave Forecasts & Signals

Why use Elliott Wave Forecast for GBP/JPY Currency Pair?
Let our expert analysts help you trade the right side and blue boxes with timely and reliable GBP/JPY forecasts.
- Daily & Weekly Technical Videos
- Live Chat Rooms
- Live Analysis Sessions
- Sequence Reports
- Free Education and Learning
- Live Trading Room Sessions
Don't take our word for it. See what our customers say
Emily T.
“Absolutely love it! It’s exactly what I needed to organize my work and life. Highly recommended.”

Alex R.
“Customer support was responsive and helpful. A few bugs here and there, but overall a solid experience.”
Sarah M.
“I was skeptical at first, but after using it for a week, I’m hooked. Everything is so intuitive and clean.”
John D.
“This app has completely changed the way I manage my daily tasks. Super easy to use and very reliable!”
This is testing for now
This is only for testing
Edwardo Tellez
"Outstanding site for educational content, trading information and live sessions. If you are serious about learning to trade whether you're a beginner or expert, the talented and friendly mentors support you every step of the way!"

GBP/JPY Forecast using the Blue Box Approach
The blue boxes are often elucidated on the charts we provide to our clients, signaling a potential area of interest where there would be high volume and liquidity for trade executions. Usually, the blue boxes signify the corrective sequences of the market we are trading. For instance, it represents and characterizes the 3,7 and 11 swings-to-end on our blue boxes. Such areas are considered highly low-risk areas, as they represent lucrative trading opportunities with a higher probability of working and a higher risk-to-reward ratio.
Learn to trade the right side with blue boxes.

GBPJPY [21 August 2020]
Price reached a blue box, our members knew buyers should enter in the blue box to resume the rally for a new high above red A peak or produce 3 waves reaction higher at least.

GBPJPY [26 August 2020]
GBP JPY Pair found buyers in the blue box and rallied nearly 200 pips in the form of 5 waves impulse over the course of next few days allowing any traders who bought the pair in the blue box to move stop to entry level.
GBP/JPY Forecast, News & Analysis
Check our updated for GBP/JPY News including real-time updates, forecast, technical
analysis and the economic latest events from the best source of Forex News
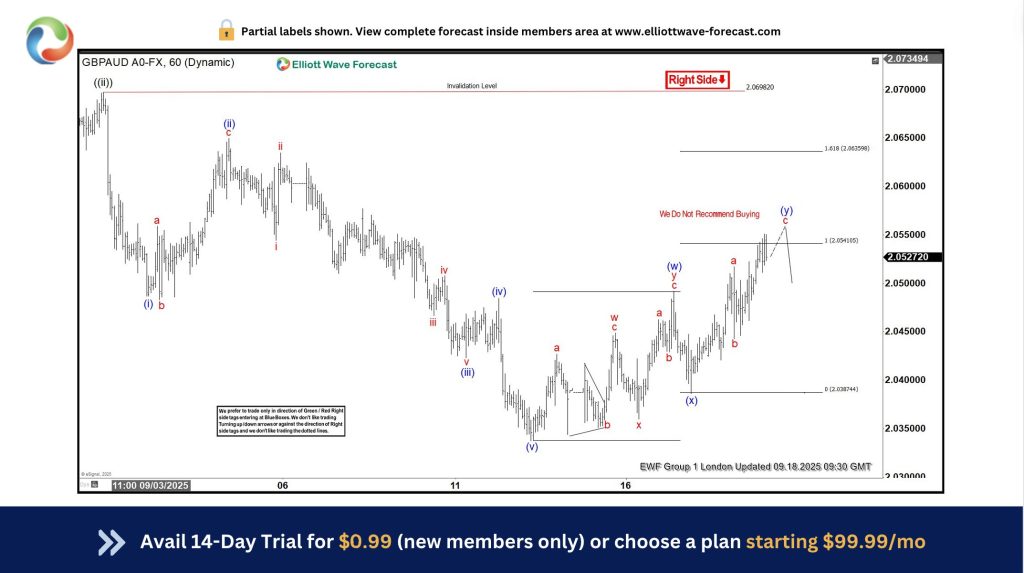
GBPAUD Elliott Wave : Calling the Decline from the Equal Legs Zone
Hello fellow traders. In this technical article we’re going to look at the Elliott Wave charts of GBPAUD Forex Pair published in members area of the website. As our members know, GBPAUD has…
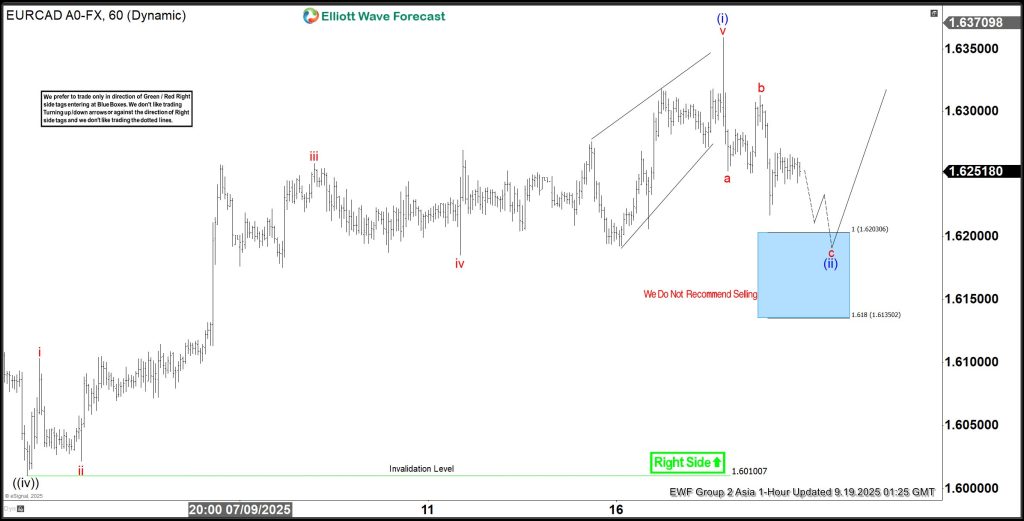
EURCAD Bounces Back: Reaction Higher from Blue Box Area
In this technical blog, we will look at the past performance of the 1-hour Elliott Wave Charts of EURCAD. In which, the rally from 02 September 2025 low unfolded as impulse…
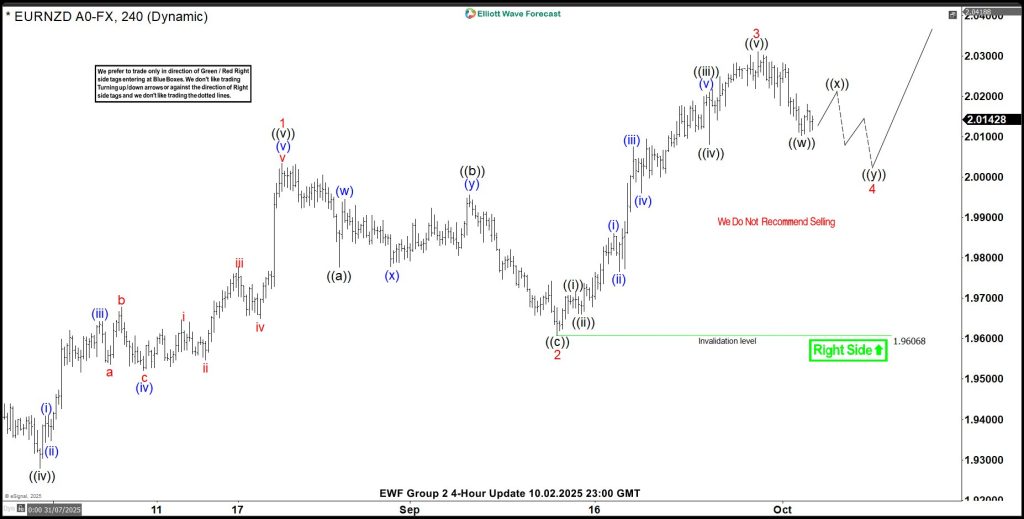
EURNZD Analysis: Bullish Sequence Targets Further Rally From Lows
Hello traders and welcome to a new blog post. In this one the spotlight will be on the EURNZD currency pair. This pair has been in a long-term bullish sequence…
GBP JPY Forecast & Signals – Elliott Wave Analysis
Our traders and analysts conduct robust Fibonacci, Elliot wave structures, correlation, trendlines, market dynamics, sequences, and Elliot cycles analysis before calling a specific asset class bullish or bearish. This profound type of analysis helps us attain more accurate price movements and a higher win rate. Moreover, such deep analyses on different asset classes, forex pairs, commodities, and stocks help us remain on the right side of the trend! This means we always try to trade within the trend and not go against it. The number one rule of trading any financial market is, “do not go against the trend.” Our traders and analysts have formulated such strategies that help them remain on the right side of the trend, thus eliminating the potential “against the trend” losses.

GBP/JPY Technical Analysis and Trading Strategy
Elliott Wave
Elliott wave analysis is one of the most used technical tools by traders and investors in the financial markets. Elliott wave analysis gives you a very profound outlook of the specific market you are trading. With the help of Elliot wave structures, it elucidates potential areas of interest for entering the market and gives you a precise outlook of the overall price movement. Moreover, Elliot wave analysis can help understand the waves that can potentially occur on the GBP/JPY pair. As the pair is highly volatile, Elliot wave analysis can be used on the pair to gauge potential massive market moves. However, it is vital not to depend upon the Elliot wave analysis as the only part of your trading plan. Our traders and analysts at Elliott Wave Forecast use Elliott Wave analysis as a part of our trading plan with a wide variety of technical trading tools and phenomena. For example, our traders and analysts have a daily technical check-list when analyzing any forex pair, commodity, stock, or any other asset class.
Blue Boxes
Our traders and analysts at Elliott Wave Forecast use Blue boxes as an area of interest where a potential trend reversal or trend continuation occurs. The blue boxes are specially designed high-frequency inflection areas that provide pinpoint entries on the trend’s right side. Our traders have orchestrated and curated these high probability areas by using different technical tools such as market dynamics, sequences, wave structures, Fibonacci retracement, and extension levels.
Fibonacci
Fibonacci is one of the most famously traded technical tools on the forex market. The Fibonacci is a potent tool as it has multiple uses. For example, traders use Fibonacci to attain potential retracement levels on an on-going trend, or they use Fibonacci extensions to orchestrate their profit target levels on their existing positions. Our traders at Elliot wave forecast use Fibonacci retracement and extension tools in combination with sequences and Elliot wave analysis. This helps us attain a more educated and precise outlook on a market we are trading. As GBP/JPY is a highly volatile pair, it tends to create long waves with no retracements. For this reason, finding a retracement with the Fibonacci retracement tool for buying/selling into the existing trend can be a highly lucrative and profitable strategy for trading GBP/JPY.
Trendlines
Don’t get me wrong; trendlines are compelling technical tools. Trendlines have multiple purposes. Most of the traders use it for understanding the strength of a specific trend, while others use it for trading breakouts. Moreover, a trendline can be used to gauge the intensity of a trend by following a simple rule, “The steeper the trendline, the stronger the trend, and the linear the trendline, the weaker the trend.”
Market Correlations
GBP/JPY has a positive correlation with the Nikkei-225 Japanese index. This is because of multiple reasons, including the stability of Yen. For example, whenever the Nikkei-225 is looking to move up, GBP/JPY tends to follow it. We at Elliot wave forecast undertake multiple correlation analysis. For instance, we use the concept of first- and second dimension correlations. Our traders also utilize different correlations of this pair with other asset classes. The correlation analyses are instrumental in attaining a precise and accurate image of the market, in other words, getting an edge in trading the markets.
GBP/JPY and Trading Days/Hours
As the pair is volatile, the trading hours for this pair are comprehensive. From Sunday to Friday, GBP/JPY is known to offer lucrative trading opportunities that can have potentially huge targets and consistent profits. Most of the currency pairs on the forex markets are known to be less liquid and less volatile; thus, they offer fewer opportunities in a trading week. On the contrary, it is almost evident that day traders and scalpers easily find 1 to 3 trades on this pair on a daily basis. Besides, the best trading hours for this pair are in the overlap of London and NYO sessions.
GBP/JPY Forecast and Fundamental Analysis
Trading GBP/JPY may require two fundamental side research. For example, macro-economic analysis for Great Britain (GBP) and another research for Japan (Yen). Trading GBP/JPY while knowing the potential fundamental factors that drive this market can be soothing. However, our Elliott Wave Forecast traders do not use any fundamental themes for attaining an educated and precise view of the market. Our traders and analysts believe that fundamentals can be an add-on to your overall market research; however, it is not vital to add it to your investment or trading thesis, as technical analyses can elucidate all the trading opportunities.
The GBP/JPY trading pairs’ main fundamental drivers are GDP, Inflation report, Coronavirus development, Vaccine rollouts, Brexit, and Japan’s stock market (mainly Nikkei-225 stock average index).
