RELIABLE NIFTY 50 FORECAST
Daily Accurate Nifty 5 Trading Signals
1 Hour, 4 Hour, Daily & Weekly Elliott Wave Counts
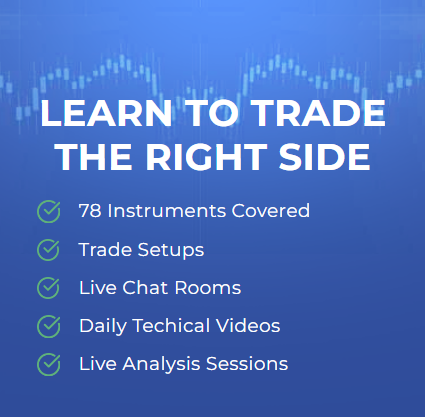
Live analysis sessions and trading rooms
Daily technical videos, sequence reports & more…


Nifty 50 Trading Signals
Trade with confidence with exclusive Elliott Wave Forecasts
The Nifty 50 is among India’s diverse benchmark indexes, tracking the market movements of the biggest businesses registered on the Stock Exchanges. Investors commonly use it to assess the state of the economy as a whole.
The fact that the Nifty encompasses firms from 14 distinct sectors is one of the key reasons it is rated as a solid predictor of stock market success. Consequently, an individual who invests in the Nifty 50 index may effectively introduce oneself to a diverse variety of firms in a single transaction, lowering his risk exposure significantly.
But how can you participate in Nifty? Because it is an index, you cannot buy it like a share. However, there are alternative methods to benefit from the index’s changes.
We at Elliott Wave Forecast understand that not everyone can be a financial expert but that shouldn’t prevent you from taking advantage of such rewarding opportunity.
Why use Elliott Wave Forecast for Nifty 50?
Let our expert analysts help you trade the right side and blue boxes with timely and reliable Nifty 50 forecasts.
- Daily & Weekly Technical Videos
- Live Chat Rooms
- Live Analysis Sessions
- Sequence Reports
- Free Education and Learning
- Live Trading Room Sessions
Don't take our word for it. See what our customers say
Emily T.
"“Absolutely love it! It’s exactly what I needed to organize my work and life. Highly recommended.”"

Alex R.
"“Customer support was responsive and helpful. A few bugs here and there, but overall a solid experience.”"
Sarah M.
"“I was skeptical at first, but after using it for a week, I’m hooked. Everything is so intuitive and clean.”"
John D.
"“This app has completely changed the way I manage my daily tasks. Super easy to use and very reliable!”"
This is testing for now
"This is only for testing"
Edwardo Tellez
""Outstanding site for educational content, trading information and live sessions. If you are serious about learning to trade whether you're a beginner or expert, the talented and friendly mentors support you every step of the way!""

Nifty 50 Forecast using the Blue Box Approach
Elliott Wave Forecast traders and analysts utilize blue boxes as a region of interest when a probable trend reversal or trend continuation occurs. The blue boxes are specifically constructed high-frequency inflection zones that allow precise entrances on the trend’s right side. Our traders staged and curated these high likelihood locations by using several technical tools such as market dynamics, sequences, wave structures, and Fibonacci retracement and extension levels. These blue boxes are often highlighted on the charts we send to our customers, indicating a possible region of interest with significant volume and liquidity for trade executions. Frequently, the blue boxes represent the market’s corrective sequences. For example, our blue boxes symbolize and describe the 3, 7, and 11 swings. Such opportunities are low-risk since they provide attractive trading possibilities with a greater likelihood of success and a more excellent risk-to-reward ratio.
Learn to trade the right side with blue boxes.

Nifty 50 [1 November 2020]
Price entered a blue box and our members knew that 3 waves correction should end in the blue box after which price should turn higher to resume the rally or bounce in 3 waves at least.

Nifty 50 [10 November 2020]
Nifty 50 Index founds buyers in the blue box as expected and rallied over 800 points in the next few days producing nice profits for our members
Nifty 50 Forecast, News & Analysis
Check our updated for Nifty 50 News including real-time updates, forecast, technical
analysis and the economic latest events from the best source of Stock Market News

Gold Miners (GDX) Buying the Dips at the Blue Box Area for More Upside
As our members know we have had many profitable trading setups recently. In this technical article, we are going to present another Elliott Wave trading setup we got in Gold Miners…

GOLD (XAUUSD) Elliott Wave : Buying the Dips at the Blue Box Area
Hello traders. As our members know, we have had many profitable trading setups recently. In this technical article, we are going to talk about another Elliott Wave trading setup we…
What is the best way to trade the Nifty?
You may participate in the Nifty index in two ways: via derivatives or via mutual funds. Let’s take a gander at these approaches.
Investing in Nifty Derivatives
The underlying asset in Nifty derivative transactions such as futures contracts is the stated index. This simply indicates that the market price of the derivatives is related to that of the indices. Trading and investing in these derivatives, you may practically benefit from the index’s price changes.
That being said, there is one thing to keep in mind. Because the index is not a stock, you will not be able to take delivery of it when its derivative contracts expire. Instead, all index derivatives will be required to be cash-settled at the conclusion of the expiration period.
Now that you understand how to participate in Nifty with derivatives, let us further understand how to invest in Nifty using futures contracts.
Investing in Nifty using mutual funds
Mutual funds, like index funds, invest in the same equities that comprise indexes such as the Nifty. This enables these investments to monitor the underlying index, enabling stakeholders to invest in the business model provided by the index, as mentioned earlier. Index funds, as opposed to other types of mutual funds, are less expensive, offer more diversity, and have a higher probability of giving investors positive returns. Investing in Nifty index funds essentially means investing in all 50 constituents of the Nifty index, giving you substantially overall market coverage.
Investing in the Nifty using Futures Contracts
If you have a bullish and bearish perspective on the Nifty index, you may utilize index futures contracts to benefit from market changes. Assume the Nifty is presently valued at 6000 on April 1, 2021. You believe the index will climb to roughly 8,000 by the expiration date because you have an optimistic outlook.
So, how would you trade the Nifty employing futures? Here are a few Nifty trading tips. All you have to do is buy the Nifty Future contracts at 6000. And if the index increases as expected and reaches 80000 before the deal ends, you may immediately close your trade and benefit.
Assume you have a negative outlook and predict the market to drop to roughly 5,000 by the expiration date. How are you doing in this situation? Could you still utilize index futures? Of course, you can. Here’s a fantastic little Nifty trading approach. In this situation, you have to conduct a short-sell method to sell the Nifty at 6,000. If the index moves as anticipated and falls under 6,000 before the expiration of futures contracts, you can close the position and take profits.

Trading Strategy and Technical Analysis For the Nifty 50 Index
Elliott Wave Analysis
Elliott wave analysis is a popular technical technique among traders and investors in the financial markets. Elliott wave analysis provides you with a comprehensive view of the market in which you are dealing. It elucidates possible regions of interest for entering the market and provides a clear overview of the entire price movement using Elliott wave patterns. Furthermore, Elliot wave analysis may be quite valuable in analyzing the waves that may occur on the Nifty 50 index. Because the index is very volatile, Elliot wave analysis may be utilized to forecast likely significant market changes. However, you must not rely just on Elliot wave research as part of your trading strategy. Elliott Wave Analysis is used by our traders and analysts at Elliott Wave Forecast as part of our trading strategy, along with a broad range of technical trading tools and occurrences. For example, whether analyzing any index, commodity, stock, or other asset class, our traders and analysts follow a daily technical checklist. Before labeling an asset class as bullish or bearish, our traders and analysts perform thorough Fibonacci, Elliot wave structures, correlation, trendlines, market dynamics, sequences, and Elliot cycles research. This in-depth research enables us to achieve more precise price movements and a better victory rate.
Furthermore, such in-depth analysis of various asset classes, FX pairings, commodities, and equities helps us stay on the right side of the trend! That is, we always strive to trade with the trend rather than against it. The number one rule of trading any financial market is “do not go against the trend.” Our traders and analysts have devised tactics to keep them on the right side of the trend, reducing the possibility of large “against the trend” losses.
Fibonacci Sequence
Fibonacci is a well-known and often-used technical instrument in the financial market. The Fibonacci sequence is a highly effective tool with several applications. Traders, for example, employ Fibonacci to achieve probable retracement levels on an ongoing trend, or they utilize Fibonacci extensions to orchestrate their profit target levels on current holdings. Elliot wave prediction traders use Fibonacci retracement and extension methods in conjunction with sequences and Elliot wave research. This allows us to have a more informed and accurate viewpoint on the market in which we trade. Because all the indices are considered volatile, it tends to form lengthy waves with no retracements. As a result, using the Fibonacci retracement tool to locate a retracement for buying/selling into the current trend may be a very lucrative and successful approach for trading the nifty 50.
Trendlines
Don’t get me wrong: trendlines are really effective technical tools. Trendlines serve many functions. Most traders use it to determine the strength of a trend, while others use it to trade breakouts. Furthermore, a trendline may be used to determine the strength of a trend by following a simple rule: “The steeper the trendline, the stronger the trend; the linear the trendline, the weaker the trend.”
Correlations in the Market
The valuation of Nifty 50 has a profound correlation with the NSE sectoral indices. As the performance of the economy deeply influences the sectorial NSE indices; thus it also has a great impact on the overall valuation and price movement of the Nifty 50. Therefore, it is crucial for traders and investors to curate and orchestrate a trading plan in light of this correlation before making trading or investing decisions. We, at Elliot wave forecast, undertake different market correlation methodologies across a wide variety of asset classes. We also apply first- and second dimension market correlations, which allow us to gauge a profound and transcalent perspective of the markets.
