RELIABLE SILVER FORECAST
Daily Accurate Silver (XAG) Trading Signals
1 Hour, 4 Hour, Daily & Weekly Elliott Wave Counts
Live analysis sessions and trading rooms
Daily technical videos, sequence reports & more…
Silver Trading Signals
Trade with confidence with exclusive Elliott Wave Forecasts
Due to its high huge trading quantities and narrow margins, silver is a particularly marketable commodity. Because of its significant volatility, silver trades with different price charts. Because silver is a relatively small market than Gold, day traders appreciate that this has historically been much more erratic than Gold. Because of this volatility, they may profit from large intraday market movements.
Silver is also used in various manufacturing applications, including computers, optics, orthodontic metals, and much more. Silver is in demand as embed security by industrial firms and consumers.
We at Elliott Wave Forecast understand that not everyone can be a financial expert but that shouldn’t prevent you from taking advantage of such rewarding opportunity.
Why use Elliott Wave Forecast for Silver?
Let our expert analysts help you trade the right side and blue boxes with timely and reliable Silver forecasts.
- Daily & Weekly Technical Videos
- Live Chat Rooms
- Live Analysis Sessions
- Sequence Reports
- Free Education and Learning
- Live Trading Room Sessions
Don't take our word for it. See what our customers say

Silver Forecast using the Blue Box Approach
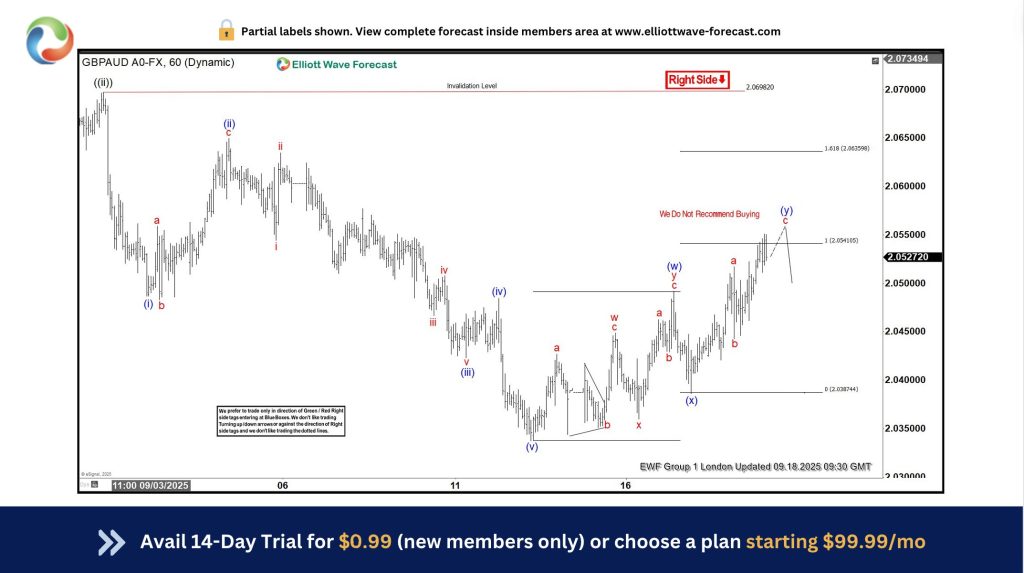
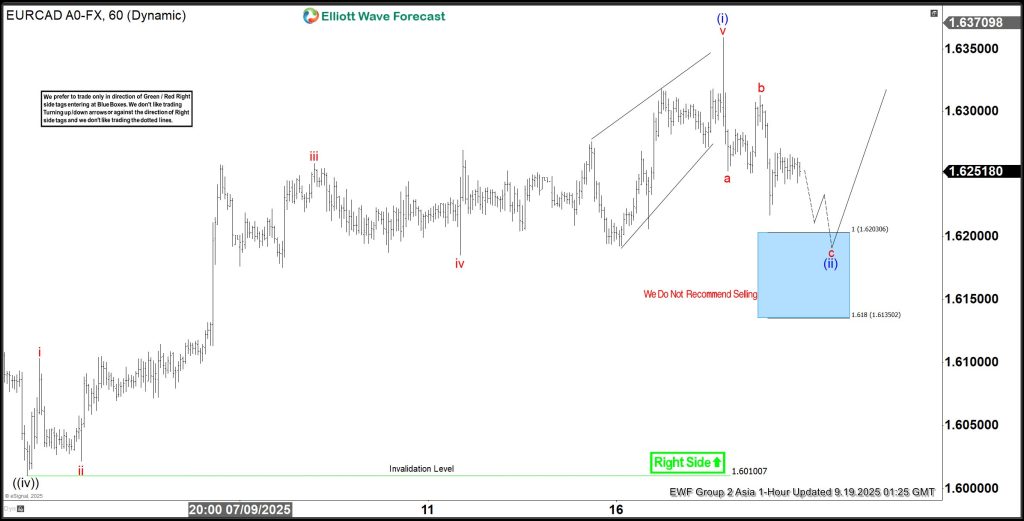
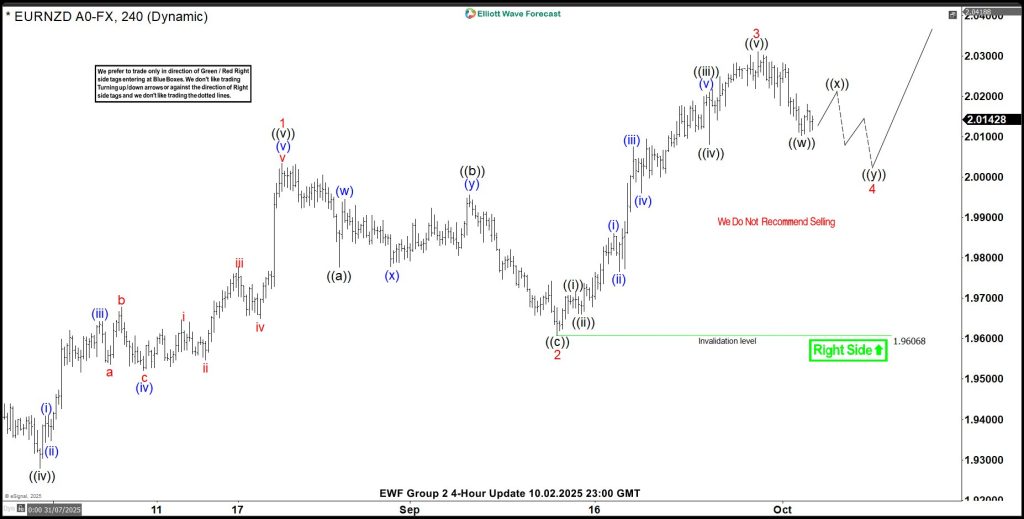
Our experts at Elliot Wave Forecast often employ the blue boxes specifically created high-frequency inflection zones of interest. These blue boxes are placed on the chart in locations where there is a greater possibility of either a trend shift or trend continuance, allowing us to remain on the right side of the trend! The blue boxes often appear on our charts. Furthermore, the blue boxes represent and describe the markets’ corrective sequence. It indicates the 3,7, or 11 swings to finish, for example. It also covers a variety of cycles and sequences that are often computed using various Fibonacci extensions. Our blue boxes reflect a relationship between buyers and sellers in a particular chart region. This allows us to coordinate our holdings in such places since they are relatively low-risk regions of interest, with the possibility for the market to move at least three swings in the trend’s direction.
Learn to trade the right side with blue boxes.
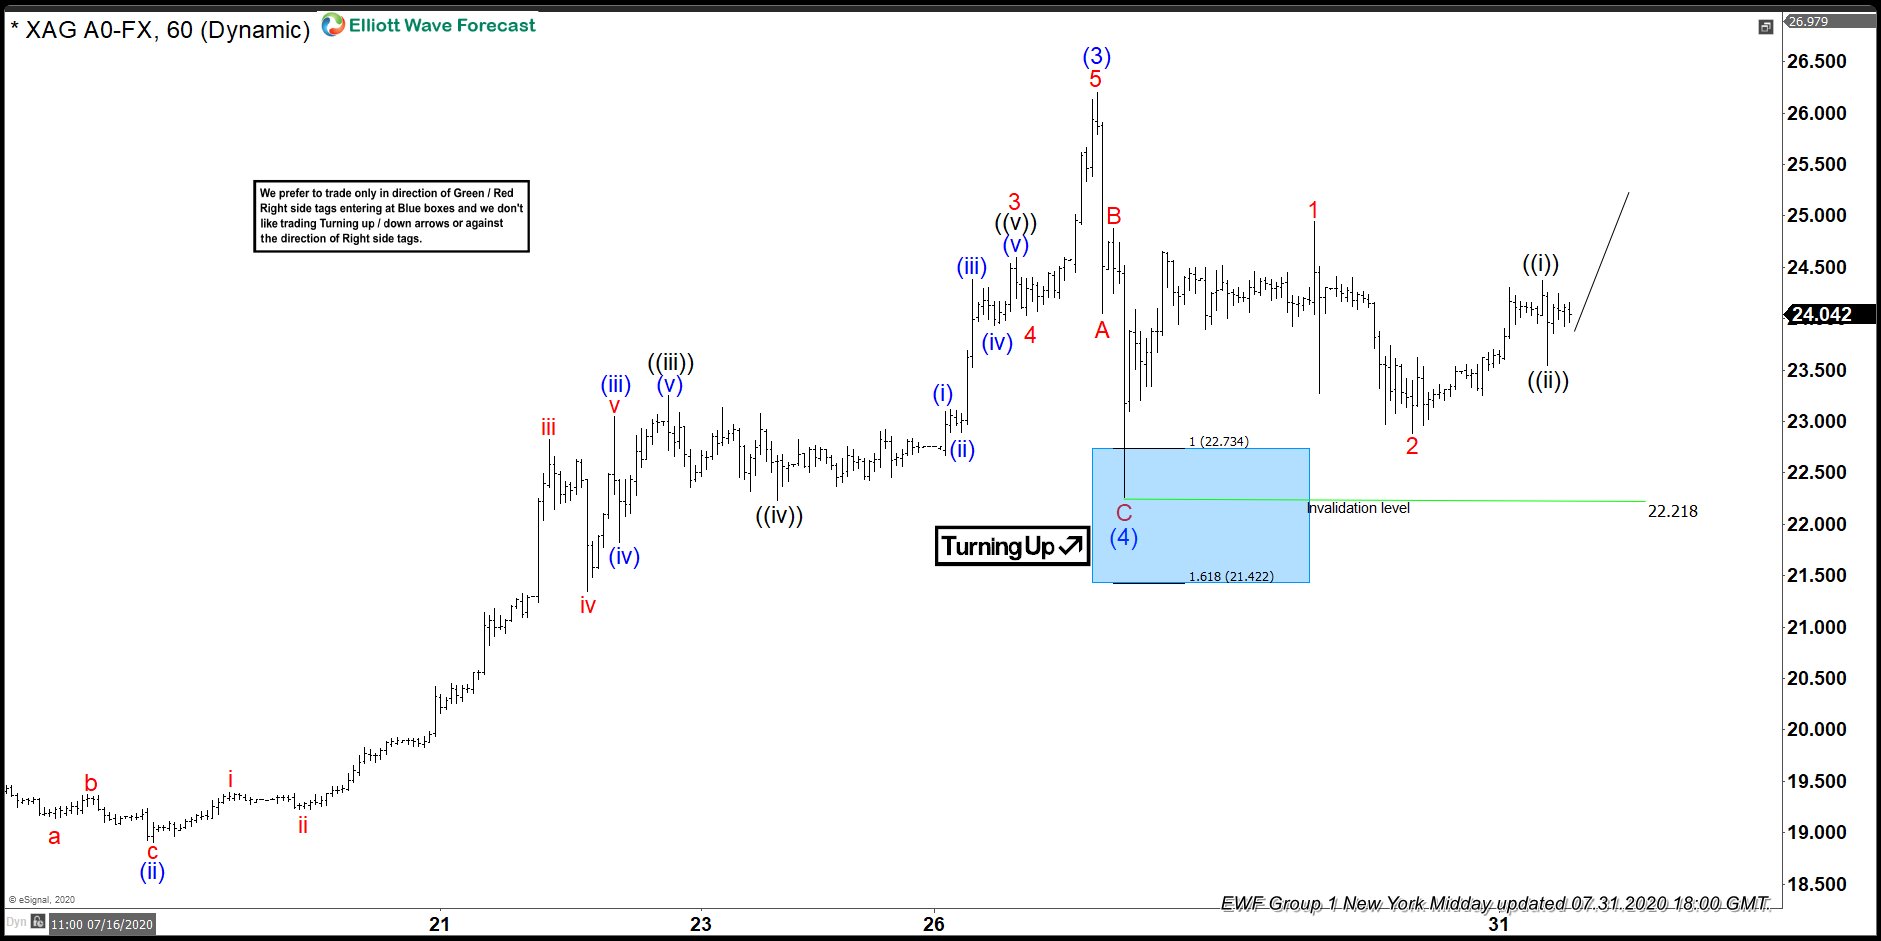
Silver [July 31 2020]
Silver reached a blue box and reacted higher, while dips stayed above $22.218 low, we expected Silver to continue above wave (3) high in wave (5)
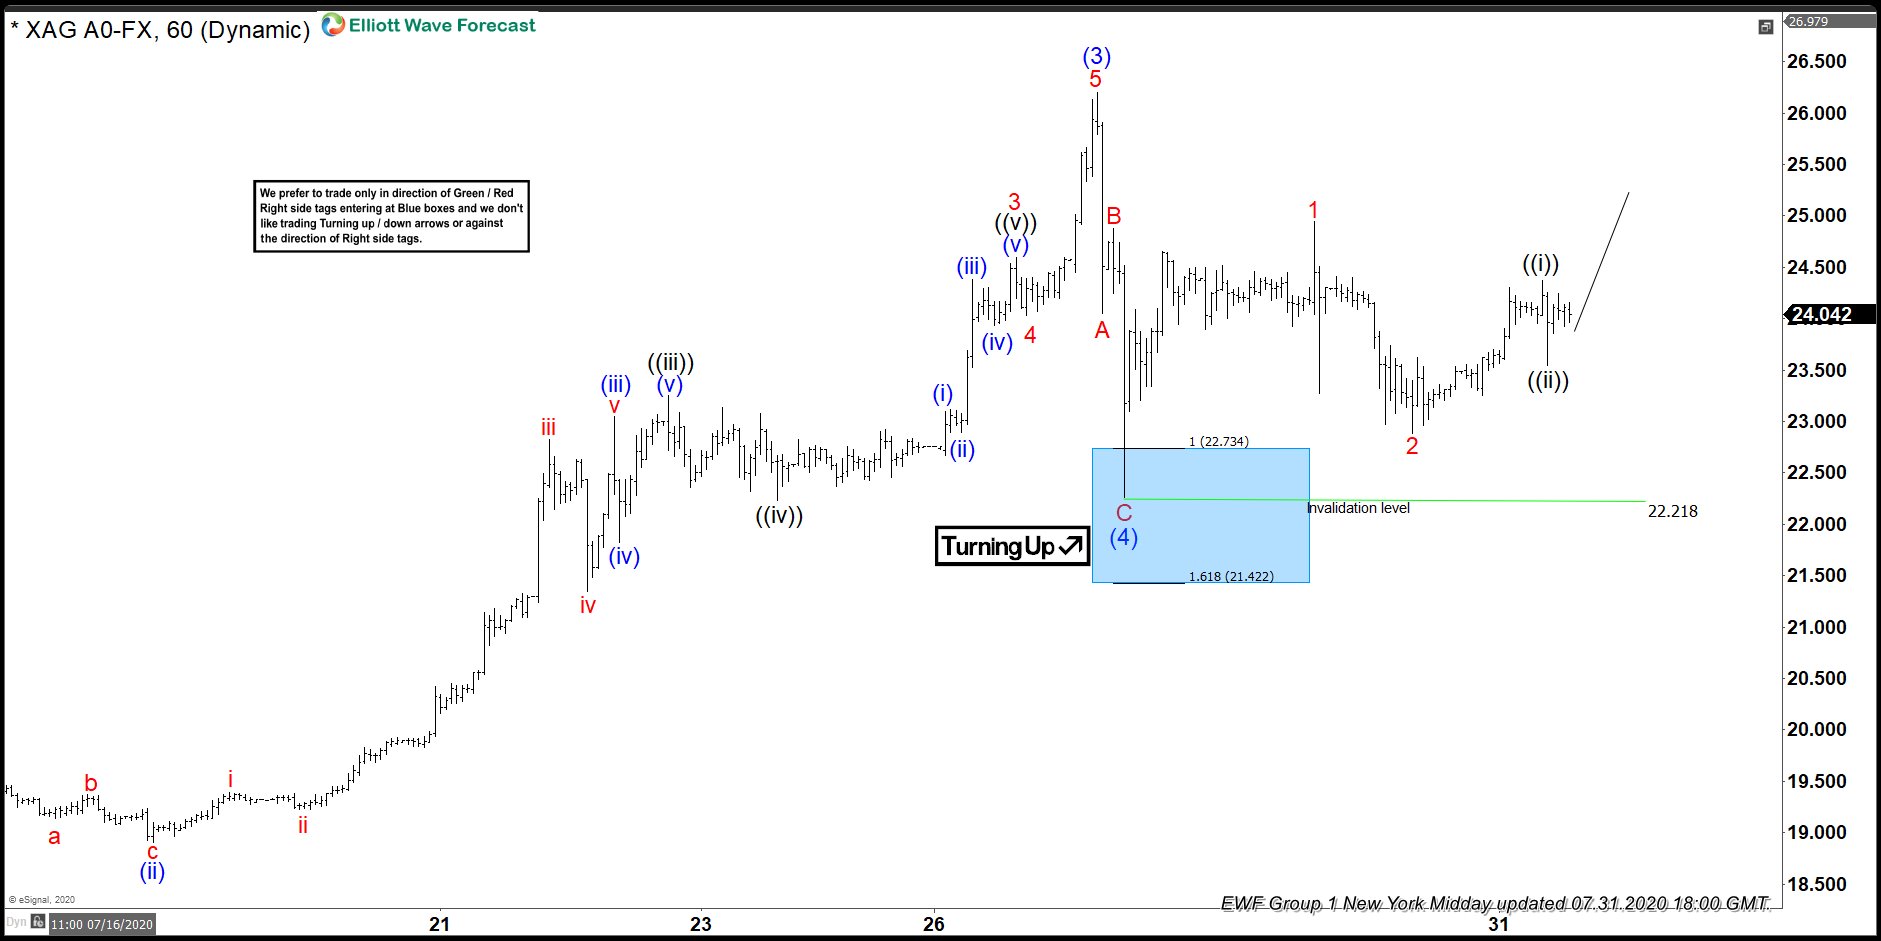
Silver [5 August 2020]
Silver continued the rally as expected and made a new high above wave (3) peak. It rallied nearly $4 from the blue box low within a few days of reaching the blue box.
Silver Forecast, News & Analysis
Check our updated for Silver News including real-time updates, forecast, technical analysis and the economic latest events from the best source of Commodities News
Silver Forecast & Signals
Traders and investors who have attempted to trade silver understand how complicated it is. Silver and Gold are connected, although their fluctuations are not affected in the same manner. In essence, these are nearly inversely connected. This is because a thriving society and economy necessitate more silver. A healthy economy, but on the other side, is detrimental to Gold.
To trade silver effectively, you must first comprehend the fundamentals and basis of understanding silver’s price movements. Then you must fully understand how to execute the technical analysis. As you shall see, silver tends to make large moves in a short period and then stagnate. In reality, the value has been stuck in a somewhat limited range over the last year.
To be explicit, we do not advocate that any beginning trader concentrates on silver. I urge that experienced traders take the time to develop a proper business plan. This method must be distinct from how you typically trade markets and equities. Knowing and understanding the various supply networks as well as the demand. Suppose you are a newbie in the financial markets. In that case, it is highly recommended to join the experts who can guide you to make better decisions.
Silver Technical Analysis & Trading Strategies
There are other silver trading techniques, but confluence trading and Elliott Wave Analysis work best for trading the commodity! Here are some of the methods our expert analysts and traders utilize daily to trade silver.
Analysis of Elliott Waves
Elliot Wave Analysis is a valuable technique that helps traders anticipate future significant market changes. Elliot wave structures are used by many traders and high-end investors across the globe. The precise Elliot Wave structures assist you in predicting if a bullish or bearish wave will emerge. Elliot wave analysis is a fantastic tool, but it should not be relied on entirely. Elliot Wave Structures, along with other technological tools in our arsenal, is used by Elliot Wave Forecast. For example, our experts thoroughly examine each currency pair, commodity, stock, or asset using various technical techniques such as market cycles, correlations, sequences, and market dynamics. This enables us to create and select prospective regions of interest and target points for forthcoming market movements. This also helps us remain on the right side of the trend, also referred to as the “right side” in our Elliot Wave Forecast investment forums. Because the number one rule of trading is to avoid trading against the trend, Elliot wave structures, sequences, waves, and cycles assist us in orchestrating interest regions in the form of “Blue boxes” on our chart, allowing us to avoid trading against the trend. Trading against the trend may be dangerous to your account; it might wipe out your account in an instant!
Fibonacci
Fibonacci is one of the most influential and legitimate technical techniques for determining future price retracement levels and probable target levels. Elliott Wave Forecast specialists employ Fibonacci extensions in conjunction with sequences and wave analysis to give you actual reversal or trend continuation regions of interest. In addition, our analysts make extensive use of the Fibonacci technical tool to forecast possible price retracement levels and price extensions. Because silver is such a popular commodity, Fibonacci retracement and extension methods may help predict price moves and future target levels.
Trendlines
Trendlines are technical tools that help you determine the strength of a trend. The bearish or bullish intensity of a specific price trend may be determined by constructing a trendline from price high to lower highs or price low to higher lows to determine the price trend’s strength. If the trendline describes a large inclination/slope in the price, it is termed a strong trend; otherwise, it is termed a weak trend. When a trendline is broken, it indicates that buyers or sellers (depending on whether the trend is bullish or bearish) attempt to break through a given price. When a trendline breaks to either side, it is seen as a strong indication that the price will continue to move in the direction of the break. Trendline breaks or trendline continuations (as explained above) can be erroneous and signal false breaks of continuations. As a result, it is critical to employ many indicators in conjunction with trendlines in order to strengthen the signal with more confluences. Elliott Wave Forecast’s top traders use trendlines in conjunction with the RSI indicator and heavily rely on the proprietary distribution system to forecast the end of a specific cycle.
Correlations in the Market
Silver has a long-lasting correlation with Gold. For instance, whenever the Gold goes up or down, the Silver price tends to follow it. For this reason, it is crucial to keep an eye on Gold’s price fluctuation or future movements to add an extra confluence in your trading system while trading Gold. Elliott Wave Forecast’s top traders and analysts make use of the concept of first and second-dimension correlations. Furthermore, our traders employ various correlations of this pair with other asset classes. This gives us a competitive advantage in making more informed market judgments. It also assists us in trading on the right side of the trend. This may help you achieve your trading objectives and improve your overall trading approach.
Understanding Silver
After Gold, silver is regarded as the second most traded and valued metal. They are both valuable metals extracted from far inside the earth’s surface. They are also utilized in the production of ornaments and valuable metals. The variation, though, is really in the cost. An oz of Gold costs more than $2,000, but an oz of silver costs $29.
The distinction is obvious. Although silver is used in industry, Gold is used as protection, aka a safe-haven asset. Governments and corporations acquire it as a means of storing wealth. They believe that holding Gold will protect them if the inevitable happens. As a consequence, Gold has a negative relationship with the greenback. Gold tends to depreciate as the dollar rises. Only a tiny amount of real Gold is used to make jewelry, trophies, and decorations.
On the flip side, silver is a versatile manufacturing material with several applications. It is utilized in the production of kitchenware, cutlery, coinage, and sometimes even automobiles. Only a tiny number of individuals acquire silver for its worth as a repository of currency.
Silver Trading hours
Silver trading hours provide traders even more options. Silver can be traded almost 24 hours and 5 days a week. However, traders are unable to trade silver after the NYO session closure.


