RELIABLE S&P500 FORECAST
Daily Accurate S&P500 Trading Signals
1 Hour, 4 Hour, Daily & Weekly Elliott Wave Counts
Live analysis sessions and trading rooms
Daily technical videos, sequence reports & more…
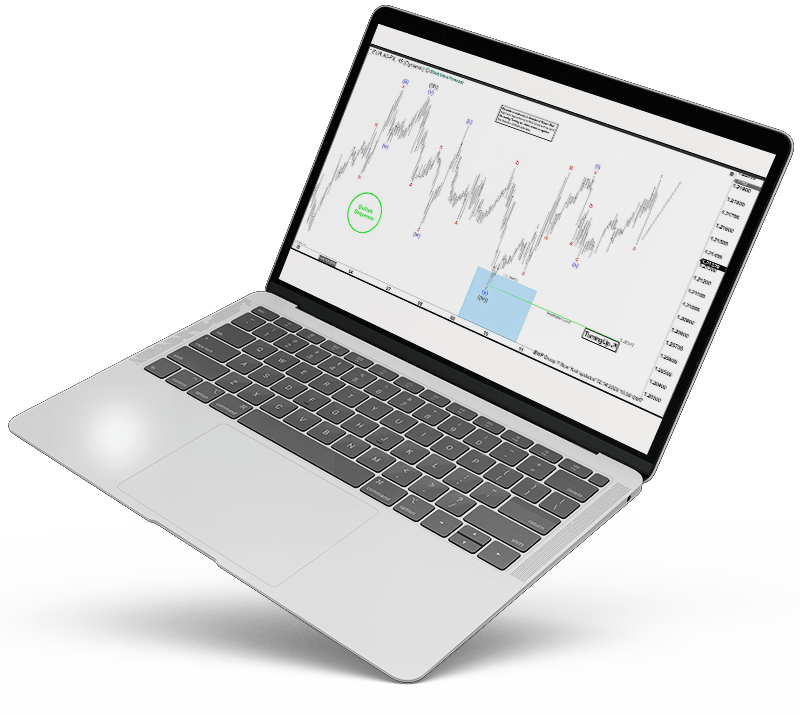
S&P500 Trading Signals
The S&P 500 is a well-known index around the world; it comprises over 500 companies. It tracks and designates the overall performances of the 500 largest companies with a high market cap in the U.S. the index is used for various purposes. Some use it for investment purposes, and some traders/investors use it to gauge the overall performance of the U.S. stock market. S&P 500 estimates the stock market’s performance by analyzing the designated 500 U.S. companies. The analysis includes benchmarking risks and returns of the companies.
S&P500 is very liquid Index and very popular among World investors; thus, it can give lucrative financial opportunities for the day traders, swing traders, positional/portfolio traders, and investors. In short, the index can be profitable for every kind of investor/trader. However, trading indexes contain a higher degree of risk as they include higher volatility and are subject to fundamental crashes.
Other reasons to trade the S&P 500 include:
– The main trend is upside; therefore, it gives clear technical patterns and signals.
– Tighter commissions for entering trades.
– Highly liquid for day trading and swing trading
– Almost consistent investment annual returns
– 24/5-time flexibility allows you to trade the SP whenever you want
Trade with confidence with exclusive S&P500 Elliott Wave Forecasts
Why use Elliott Wave Forecast for S&P500 Predictions?
Let our expert analysts help you trade the right side and blue boxes with timely and reliable S&P500 forecasts.
- Daily & Weekly Technical Videos
- Live Chat Rooms
- Live Analysis Sessions
- Sequence Reports
- Free Education and Learning
- Live Trading Room Sessions
Don't take our word for it. See what our customers say

S&P500 (SPX) Forecast using the Blue Box Approach
In summary, the blue boxes are high-frequency inflection points on the charts that our analysts orchestrate. The blue boxes are referred to as the ultimate entry areas of a market, where buyers and sellers are aligned, signaling a trend reversal or trend continuity. Furthermore, the blue boxes are organized on separate areas of a chart where a correction sequence can occur. For example, the blue boxes show 3, 7, and 11 swings to the end. Blue boxes are very low-risk zones with a greater likelihood of obtaining a successful trading opportunity while remaining on the right side of the trend.
Learn to trade the right side with blue boxes.
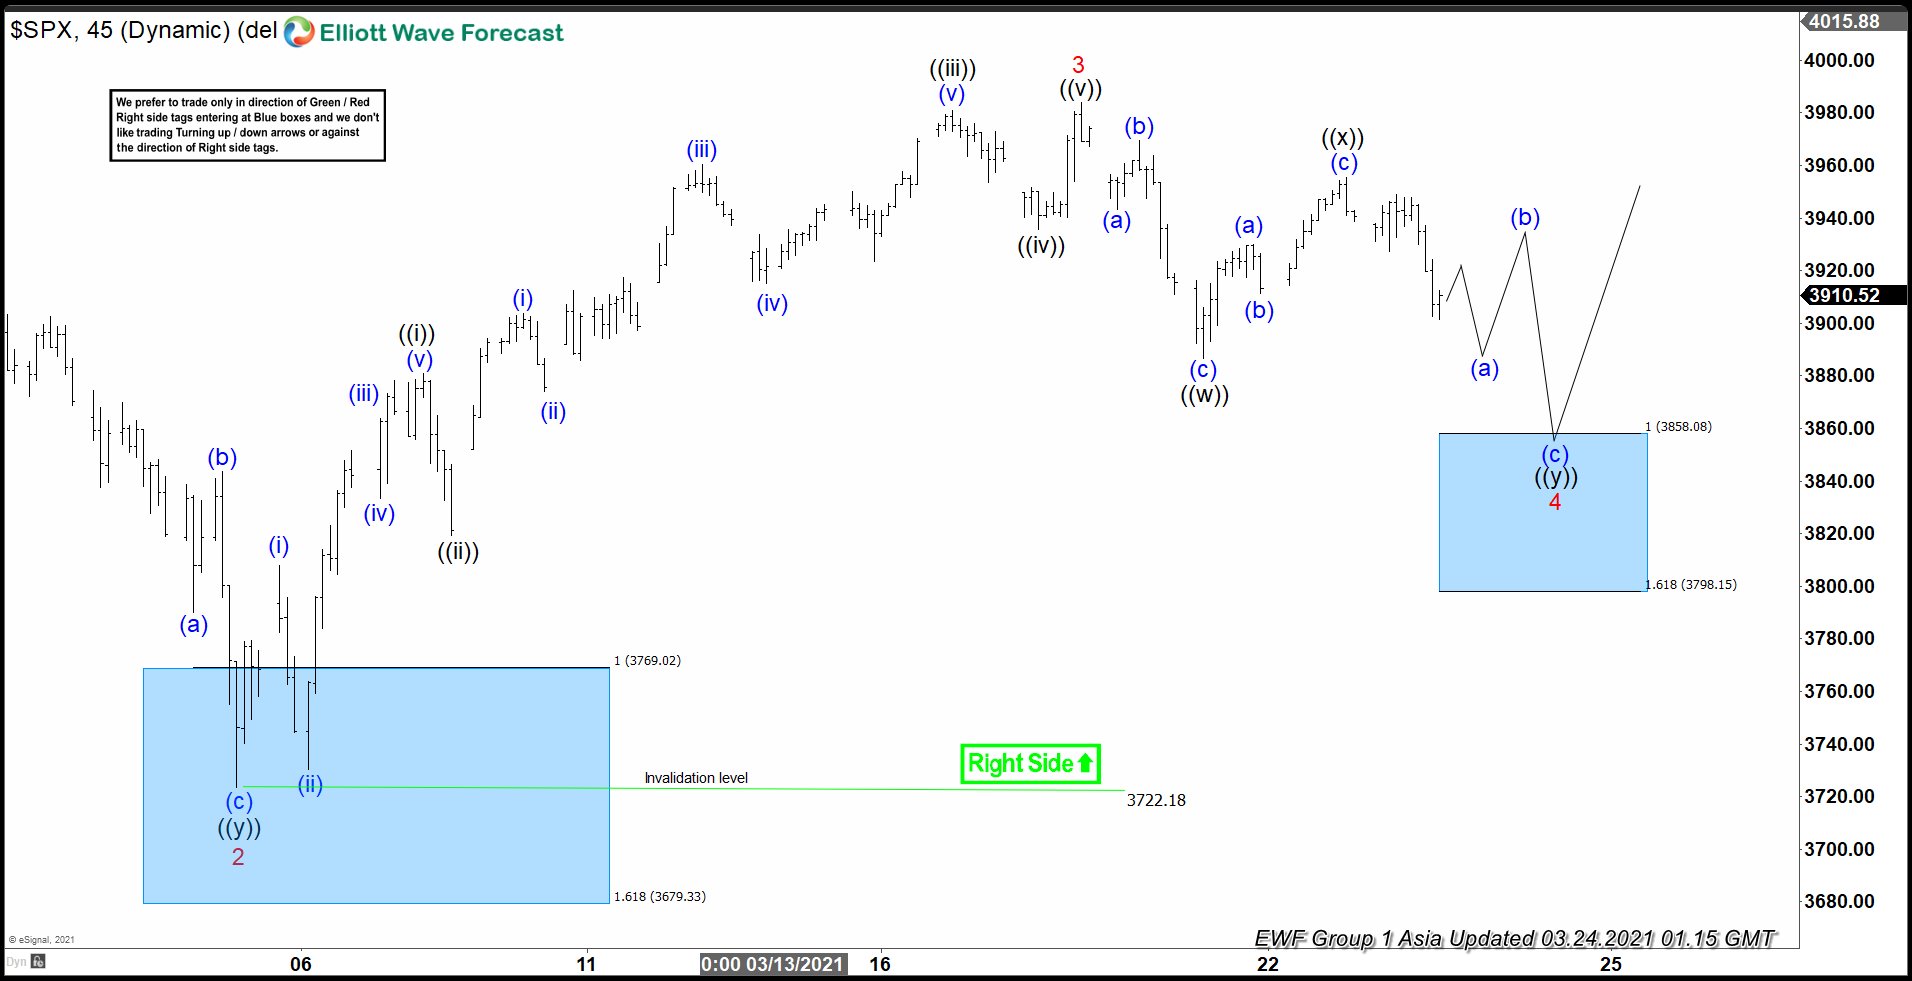
SPX [24 March 1 Hour]
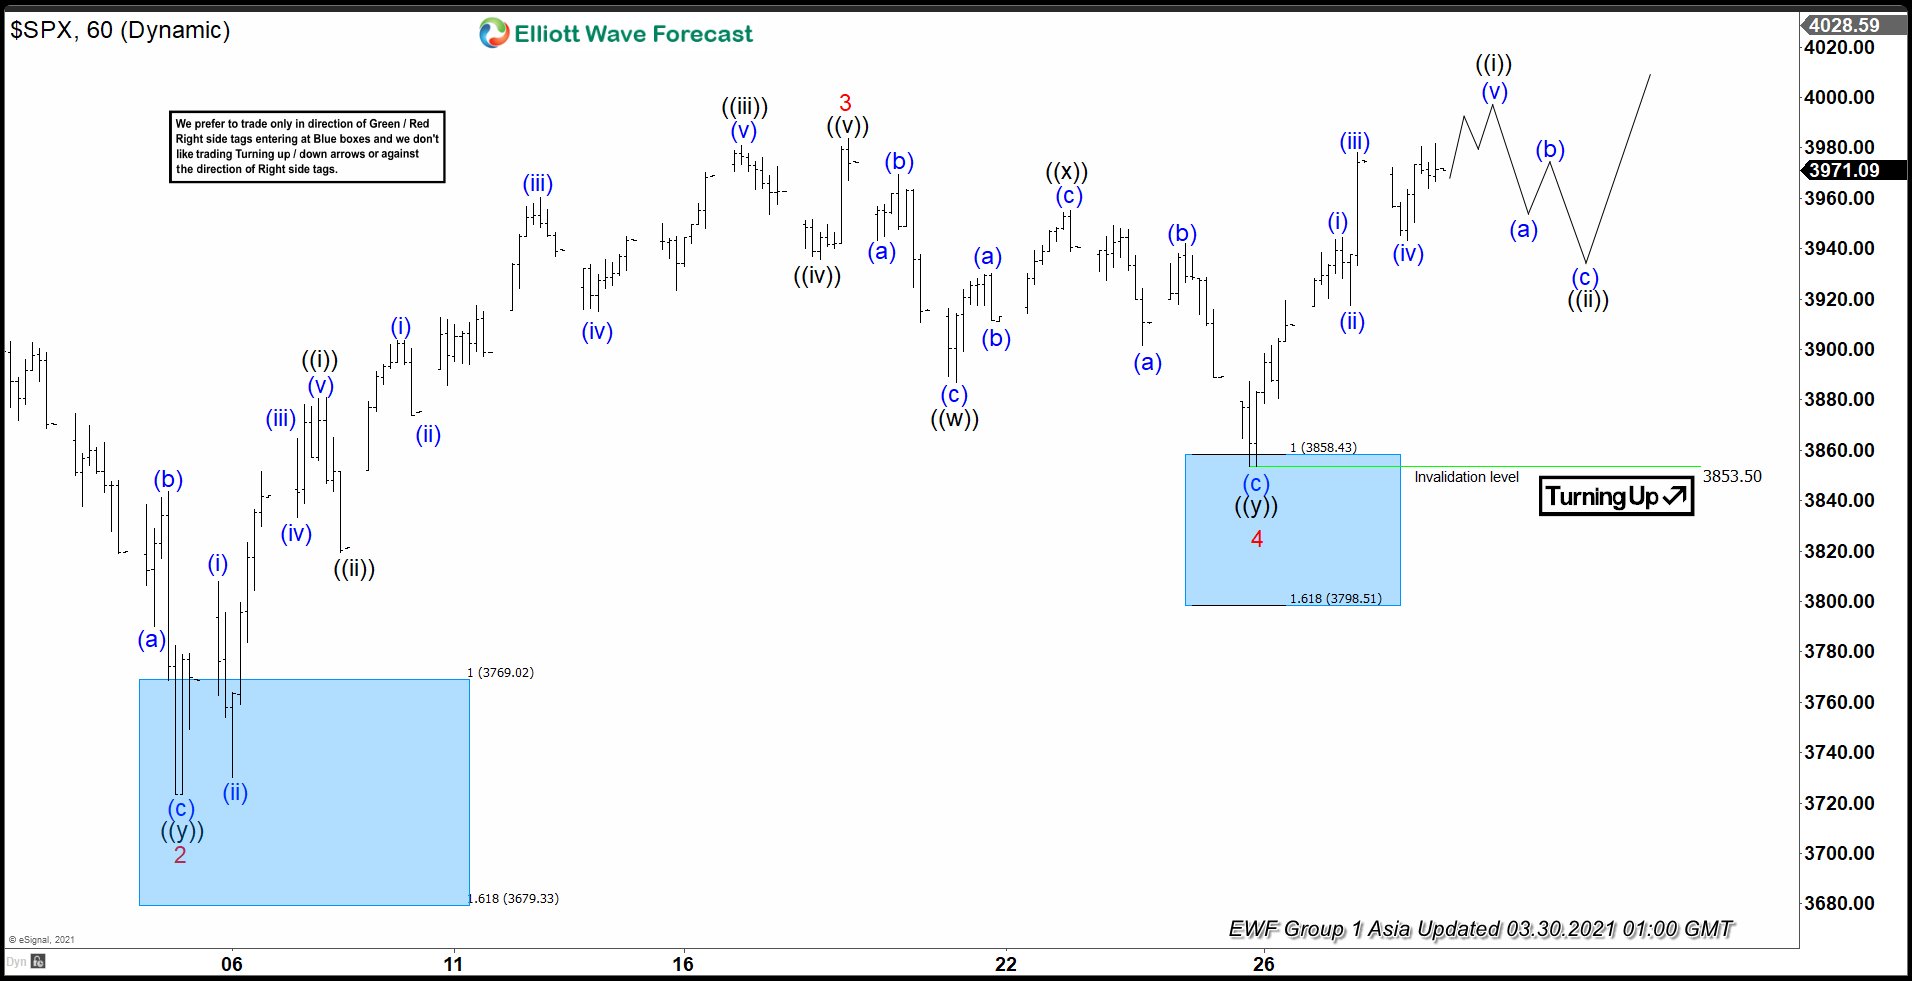
SXP forecast was calling for price to drop to the blue box to complete the correction and then buyers to appear to resume the rally or produce 3 waves bounce at least
SPX [30 March 1 Hour]
SPX found buyers in the blue box as expected and rallied 127 points in the next few trading days.
S&P500 Forecast, News & Analysis
Check our updated for S&P500 (SPX) News including real-time updates, forecast, technical
analysis and the economic latest events from the best source of Forex News
S&P Forecast & Signals
Elliott Wave Analysis is one of the most popular trading methods for the SP500 index. Elliott wave analysis is regarded as one of the most effective market analysis methods because it helps traders and analysts predict future market waves. Elliott wave analysis can be instrumental when trading dynamic indices such as the SP500, reflecting pinpoint Elliott wave structures that help traders expect a possible bullish or bearish wave. Furthermore, it enables traders to remain on the right side of the trend. The good news is that Elliott Wave Forecast’s experienced analysts and traders heavily rely on this instrument when making trading and investment decisions.
Along with Elliot wave analysis, our traders perform a host of other analyses. Market correlations, cycles, market trends, and sequences are some of our technical arsenal analysis patterns and methods. This allows us to make educated predictions upon where the next wave of the market might move. Since many of you already know that the biggest reason for failure in trading is trading against the trend, Elliot wave analysis allows you to stay on the right side of the trend and help you avoid trading against the right trend at all times.
Our analysts profoundly analyze the market with the help of Elliot wave structures, cycles, and waves which help them create high probability areas of interest, which we usually like to call “Blue Boxes.” This helps us avoid trading against the trend and take high probability trading setups, which allows us and our followers to attain lucrative and highly profitable trading opportunities.
If you want to get your hands-on S&P 500 analysis today, join us!
S&P500 (SPX) Technical Analysis
HOW TO TRADE S&P 500: THE IMPORTANCE OF A STRATEGY
Trading SPX requires having a rigid and robust trading plan, trading system, and an effective trading strategy. Without these three, success at trading SPX is little. Professional traders and investors have created algorithms, trading systems, and specific guidelines for themselves to enter the SPX trades.
The importance of a trading strategy:
- Effective trading strategy will allow you to remain emotionally rational, as you know your strategy emanates good returns over a longer period.
- Trading strategy will allow you to have predetermined levels of entry, exit, and stop loss area. This will allow you to attain regions of interest and possibly higher risk: reward ratios.
- Using technical analysis in your trading strategy will allow you to become a consistent and potent trader.
S&P 500 Trading Hours
The SPX trades can be entered and exited 24/5; thus, it is loved by many day traders and swing traders. However, it is essential to understand when the market is highly liquid and full of volume, as those times provide the best lucrative and profitable trading opportunities. Generally, the S&P 500 is busy from 9:30 AM to 4:00 PM eastern time (ET), as it is open and end time of the New York stock exchange.
USING FUNDAMENTAL AND TECHNICAL ANALYSIS TO TRADE S&P 500
Traders and investors keep an eye on the fundamental factors that influence the SP500 as it can be one of the critical factors that can help gauge the overall direction of the equity market. However, we at Elliot wave forecast do not use fundamentals for indicating the price movement. We believe that fundamentals are already priced in the markets, and technical tools such as Elliot wave analysis, wave structures, Fibonacci, trendlines, or support/resistances help us gauge the overall perspectives of the price movements.
Fundamentals behind the S&P 500
Economic data such as GDP, inflation numbers, and interest rates are one of the biggest market movers for the SPX. Traders and investors keep a keen eye on the economic calendar and ongoing geopolitical events for understanding the overall market of the SP500. As the S&P 500 is an essential index, our traders and analysts keep an eye on the forecasts by top banks and hedge funds such as S&P 500 forecast Goldman Sachs
S&P 500 Projection with Technical Analysis
Fibonacci
Fibonacci is a standard technical indicator/tool that helps traders identify particular price levels where a retracement or extension (trend continuation) may occur. The Fibonacci tool is available in various number combinations. In general, these numbers are distinguished by Fibonacci retracements and extensions. One of the most common mistakes made by new traders is to rely solely on the Fibonacci tool to make trading decisions. As a result, their trading careers are more likely to fail. Elliott Wave Forecast traders use the Fibonacci method, as well as wave analysis and sequences. As a result, we can make more informed and profitable trading decisions.
Trendlines
Trendlines are also a standard technical instrument in the forex, asset, cryptocurrency, and stock markets. Traders can see the slope of the pattern by using trendlines. One thing to keep in mind when using trendlines is that the steeper the trendline, the stronger the trend. For example, if you connect three or more Lower Highs (LH) in a bearish trend, the trendline shows a steep momentum to the downside. It signifies that the trend is strong to the downside, and the bears are still in control, which helps us understand the trend and allows us to stay on the right side of the trend. On the other hand, if the trendline is not showing steepness or specific inclination, it signifies that the trend is not so strong, and bulls might take over in the near term. Our traders highly utilize this tool to gauge trendline breaks and potential trend reversals.
Market Correlations
Market correlations are vital as they provide extra confluence to your already existing trade plan to trade the S&P 500 index. The index is highly negatively correlated with the VIX volatility index. It is one of the most meaningful correlations for the S&P 500 index as it measures the volatility and stock market expectations based on the S&P 500 futures.


